2 General context of Gadget
Ecosystem considerations appear to be an obvious, and necessary part, of the management of marine resources. Several international organizations have stressed the importance of studying ecosystems interactions in terms of management (eg. Sinclair et al. 2002, @nammco1997). Optimum fisheries management based on ecosystem consideration is however an elusive target. Even if the model sufficiently describes the target ecosystem, Voss et al. (2014) illustrated that the definition of the this optimum is dependent on the manager’s view of the resource. Although the rationale for ecosystem based approach to fisheries management is strong its adoption has been slow, which Möllmann et al. (2013) suggests is due to lack of strategy. However the effects of species interactions on the management of a commercially exploited stock is a fairly complicated and data intensive excercise, as it requires data not directly observed by fisheries. Dickey-Collas et al. (2013) note therefore that the state of knowledge is not sufficient to embark on ecosystem engineering, although in theory this would have desirable effects on the status of key resources, as such an undertaking may have undesirable and unforseen consequences.
The choice of a modelling approach used to assimilate biological information such as those obtained from scientific surveys also needs some consideration. There are a number of approaches to ecosystems models. According to Plagányi (2007) they broadly fall broadly into four categories:
- Whole ecosystem approaches, where all trophic levels of the ecosystem are modelled (e.g. Christensen and Walters 2004).
- Dynamic systems models, where where the whole ecosystem and possibly its effects to coastal communities is modelled (e.g. Link, Fulton, and Gamble 2010).
- Extensions of single–species assesment models (e.g. Livingston and Methot 1998).
- Minimum realistic models, where only a few but significant interactions are included. Examples of cases are models built using the Gadget framework (Begley and Howell 2004).
Obviously these approaches differ substantiantly both in scope and objectives. Minimimum realistic models and singles species extensions are, as the names suggest, more focussed on answering key questions and their parameters are estimated statistically. Modelling approaches, like those using Atlantis (Fulton, Smith, and Punt 2005) or Ecopath with Ecosim (Christensen and Walters 2004), often try to include a larger part of the ecosystem where it becomes harder to estimate the model parameters through comparisons with real data. These grand models tend to be more useful when answering strategic questions, such as discussed by Fulton et al. (2011), rather than more tactical issues such as direct advice on next years quota.
2.1 Gadget – a toolbox for fisheries stock assessments
Modelling approaches such as those allowed by Atlantis have, although interesting, tended to have quite obvious drawbacks in terms of comparisons to real data. Estimates of process parameters are far from trivial in this setting, both in terms of available data and more importantly computation time. A fullblown Atlantis model will generally take a substantial time for a single simulation and as such not obvious how one would obtain an “optimal” fit in a statistical sense. That said, these types of model can provide valuable insight into how an ecosystems would behave. In particular one could study certain performance metrics, such as ecosystem indicators (as described in Fulton, Smith, and Punt 2005), and various stock assessment models.
It has been observed that in various settings single species models of a marine resource fail to explain model deviations. To answer these questions extensions to the normal single species have been developed (as discussed in Magnusson 1995 and references therein). These extensions attempt to ecompass significant processes that affect the species of interest. A special type of these approaches are the mimimally realistic models mentioned above (also referred to as MICE models as discussed in Plagányi et al. 2014).
A special modelling framework, Gadget (Globally applicable, area–disaggregated ecosystem toolbox, described in Begley 2005), was developed to aid in the study of various statistical processes involved in multi–species assessments. The development of Gadget conceptually dates back to MULTSPEC (Bogstad, Hauge, and Ulltang 1997), which described a multi–species model for fish and marine mammals in the Barents sea. Many of the underlying concepts and most of the codebase that forms the Gadget framework was date back to Bormicon (Stefánsson and Pálsson 1997, @stefansson1998framework), which was developed as a continuation of a multi-species sampling program (described in MRI 1997), which has been under constant developement and iterations. Notable iterations include the Fleksibest framework (Frøysa, Bogstad, and W Skagen 2002), a fork of Bormicon which was merged back with Bormicon to form Gadget as part of the dst\(^2\) project (Taylor 2004).
The dst\(^2\) project was multi-objective project funded by the European Union and began in 1999. The basic idea was to “develop fisheries science as far as information will support” the development of statistically sound models of marine ecological processes, “but strictly no further”. Four main objectives were the following:
- Collect relevant data and provide objective means to analyse them. This included the development of Gadget and a specialised data warehouse.
- Validate present stock assessment.
- Evaluate the appropriateness of complicated models when providing management advice.
- Evaluate and validate reference points used in management.
A substantial amount of analysis has subsequently been made on Cod in Icelandic waters using the Gadget modeling framework. Notably Taylor et al. (2007) which describes a thorough analysis of the available data and potential weaknesses. In it a single species single area model is considered. A continuation of this work in a multi-stock multi-species multi-area setting are described in Taylor (2011). There it is seen that substantial improvements in the model fit are possible by considering a north – south division in the cod stock.
These developments have not been restricted to single–species models. A number of species have been analysed in a multi–species setting using Gadget. Notable implementaions include a model of the Barents sea of cod, capelin, herring and minke whales Lindstrøm et al. (2009) and subsquently Howell and Bogstad (2010) where FLR Kell et al. (2007) is used in connection with Gadget in a harvest control simulation.
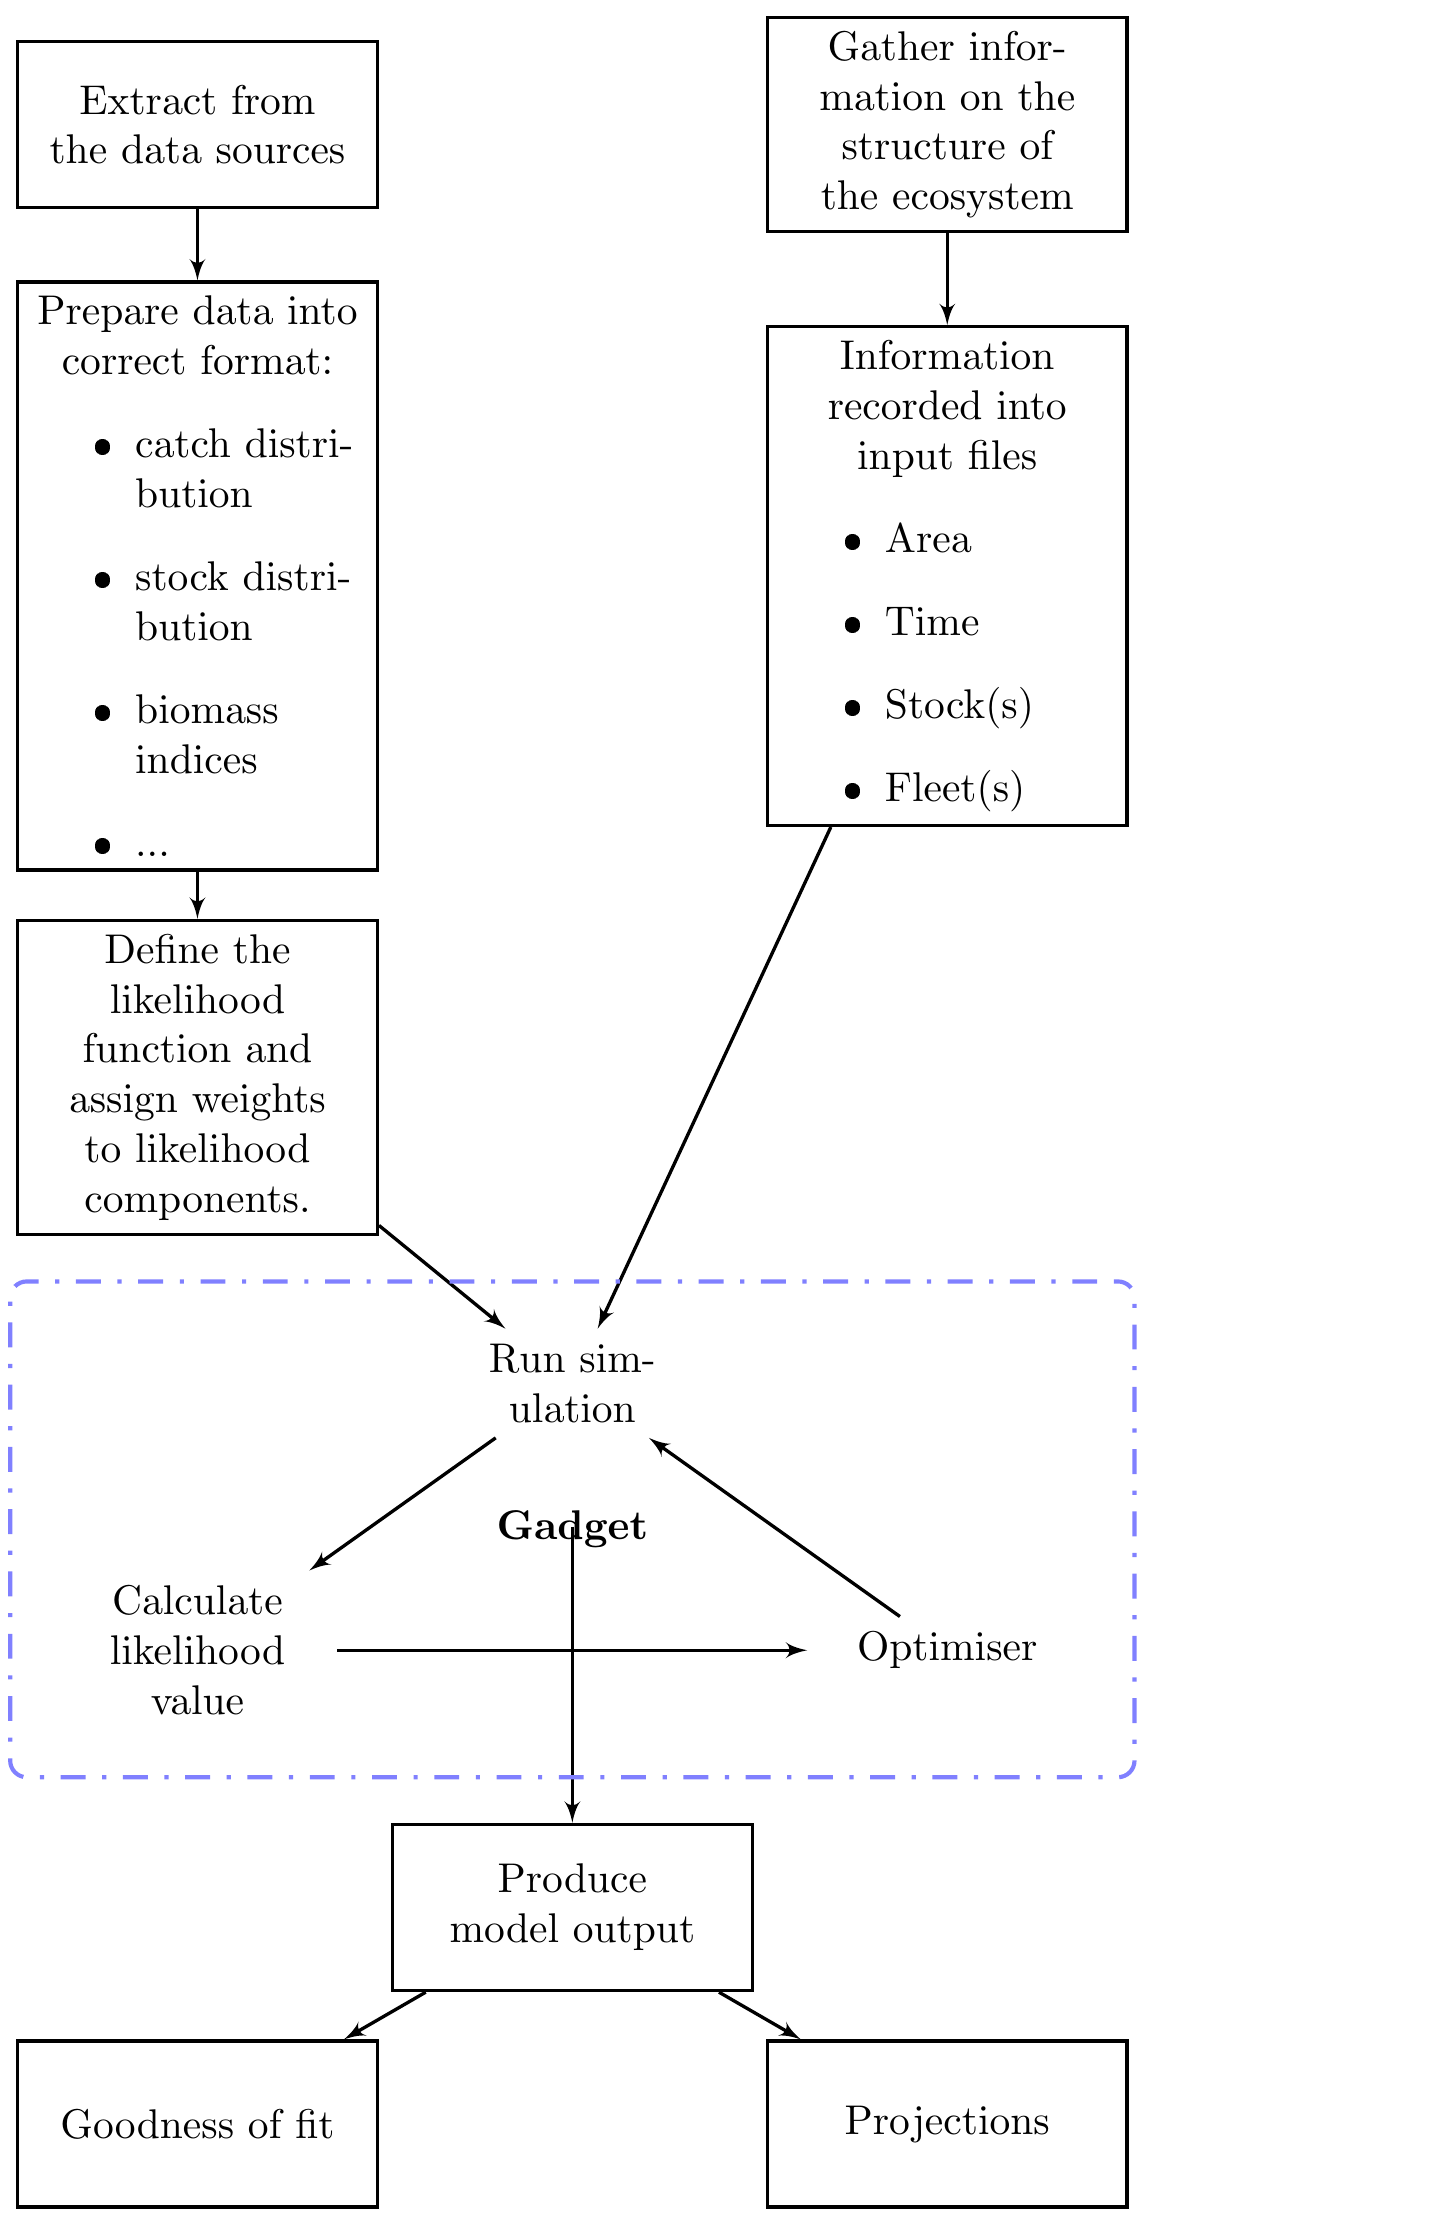 An illustration of a typical stock assessment process and the
types of uncertainty associated with each step within Gadget.
An illustration of a typical stock assessment process and the
types of uncertainty associated with each step within Gadget.
2.2 Description of Gadget
Gadget is essentially three things, an ecosystem simulator, a likelihood function that takes the output from the ecosystem simulator and compares to data, and a function mininimizer. Gadget’s simulation module allows for a fairly configurable ecosystem simulation. Its fundamental unit, a stock (or more accurately substock), represents a group of individuals that is homogenous with respect to various processes. These processes include growth, predation (including commercial fisheries) and migration. In this setup different stages of the life history of a particular species would be represented as separate stocks and individuals ``moved’’ between stocks when required. The simulation takes place in a set number of years or observations and time-steps within an observation. Years can be broken down into a maximum of 12 time-steps. The time-steps within the observations allow for the emulation of the annual cycles of the ecosystem, such as recruitment and stock migrations.
The stock unit within Gadget is simply a representation of the total number of individuals within a certain age and length group from one or more certain area. When stocks live in multiple areas, they optionally migrate among areas during definable time-steps. In this setup, processes such as fleet harvest or recruitment can be restricted to take place only in certain areas. Harvesting of the substocks is defined through fleets that fish according to effort and (length–based) selection functions.
Gadget’s likelihood module processes the output from the ecosystem simulation after aggregating across certain dimensions. Within the likelihood module, a number of datasets can be compared to the model output. In addition to a suite of functions designed to work with different types of survey indices, various other types of data , can be contrasted to the model output including compositional data (such as length distributions, age distributions, age- and length-distribution, or proportions mature) or tagging data to name a few. Each dataset is compared to model output at its own aggregation level, with missing data handled in a robust manner.
In contrast with Gadget, age-based or stock production type stock assessments require data in a fairly processed form. For instance when using VPA one requires the total catch in numbers of individuals by age. However, apart from catches of fin whales in the North Atlantic IWC (2008), one rarely has all catches by numbers at age. Therefore the age distribution of catches needs to be approximated using some combination of age readings, length distributions, total catches in tonnes and weight at age (as noted in Hirst et al. 2005). Essentially using VPA requires a two-step modelling process.
Gadget’s function minimizer, based on the negative log–likelihood (but implemented as a simple sum of squares), varies the model parameters, runs a full simulation, and calculates a new output. This process is repeated until a minimum is obtained. The model has three alternative optimising algorithms linked to it, a wide area search simulated annealing (Corana et al. 1987), a local search Hooke and Jeeves algorithm (Hooke and Jeeves 1961) and finally one based on the Broyden-Fletcher-Goldfarb-Shanno algorithm (BFGS).
The simulated annealing and Hooke-Jeeves algorithms are not gradient based, and there is therefore no requirement for the likelihood surface to be smooth. Consequently neither of the two algorithms returns estimates of the Hessian matrix. Simulated annealing is more robust than Hooke and Jeeves and can find a global optima where there are multiple optima but needs about 2-3 times the order of magnitude in iterations than the Hooke and Jeeves algorithm to converge.
BFGS is a quasi-Newton optimisation method that uses information about the gradient of the function at the current point to calculate the best direction to look for a better point. Using this information the BFGS algorithm can iteratively calculate a better approximation to the inverse Hessian matrix. When compared to the two other algorithms implemented in Gadget, BFGS is a very local search compared to simulated annealing and is more computationally intensive than the Hooke and Jeeves. However the gradient search in BFGS is more accurate than the step-wise search of Hooke and Jeeves and may therefore give a more accurate estimation of the optimum. The BFGS algorithm used in Gadget is derived from that presented by Bertsekas (1999).
The total objective function to be minimised is a weighted sum of the different components. The estimation could be difficult due to groups of correlated parameters or multiple local optima. Therefore the optimisation procedure often involves a combination of the more robust simulated annealing, to make the results less sensitive to the initial (starting) values, and the local search algorithms (Hooke and Jeeves and BFGS), to obtain more accurate final values in the neighborhood of the global optimum.
2.3 This course
During this course we will attempt to introduce how the key topic listed here above are implemented in Gadget. You will learn how to set up a simulation model using Gadget using the Rgadget functions. We will briefly discuss the how you can add data to your model and subsequently fit the model, but fuller analysis of how to include data into the model is very case specific and requires an analysis of a developed model.
C References
Begley, J. 2005. “Gadget User Guide.” Marine Research Institute, Reykjavik, Iceland) 90 Marine Research Institute Report 120.
Begley, J, and D Howell. 2004. “An overview of Gadget, the globally applicable area-disaggregated general ecosystem toolbox.” ICES CM, 1–15. http://www.hafro.is/gadget/.
Bertsekas, D P. 1999. Nonlinear programming. 2nd ed. Athena Scientific.
Bogstad, B, K H Hauge, and Ø Ulltang. 1997. “MULTSPEC–a multi-species model for fish and marine mammals in the Barents Sea.” Journal of Northwest Atlantic Fishery Science 22: 317–41.
Christensen, V, and C J Walters. 2004. “Ecopath with Ecosim: methods, capabilities and limitations* 1.” Ecological Modelling 172 (2-4): 109–39. http://www.ecopath.org/.
Corana, A, M Marchesi, C Martini, and S Ridella. 1987. “Minimizing multimodal functions of continuous variables with the ”simulated annealing” algorithm Corrigenda for this article is available here.” ACM Transactions on Mathematical Software (TOMS) 13 (3): 262–80.
Dickey-Collas, Mark, Georg H Engelhard, Anna Rindorf, Kristina Raab, Sophie Smout, Geert Aarts, Mikael van Deurs, et al. 2013. “Ecosystem-Based Management Objectives for the North Sea: Riding the Forage Fish Rollercoaster.” ICES Journal of Marine Science 71 (1): 128–42.
Frøysa, K, B Bogstad, and D W Skagen. 2002. “Fleksibest–an age-length structured fish stock assessment model.” Fisheries Research 55 (1-3): 87–101.
Fulton, Elizabeth A, Jason S Link, Isaac C Kaplan, Marie Savina-Rolland, Penelope Johnson, Cameron Ainsworth, Peter Horne, et al. 2011. “Lessons in Modelling and Management of Marine Ecosystems: The Atlantis Experience.” Fish and Fisheries 12 (2): 171–88.
Fulton, Elizabeth A, Anthony DM Smith, and André E Punt. 2005. “Which Ecological Indicators Can Robustly Detect Effects of Fishing?” ICES Journal of Marine Science 62 (3): 540–51.
Hirst, David, Geir Storvik, Magne Aldrin, Sondre Aanes, and Ragnar Bang Huseby. 2005. “Estimating Catch-at-Age by Combining Data from Different Sources.” Canadian Journal of Fisheries and Aquatic Sciences 62 (6): 1377–85.
Hooke, R, and T A Jeeves. 1961. “Direct Search Soulution of Numerical and Statistical Problems.” ACM Journal 8: 212–29.
Howell, D, and B Bogstad. 2010. “A combined Gadget/FLR model for management strategy evaluations of the Barents Sea fisheries.” ICES Journal of Marine Science: Journal Du Conseil.
IWC. 2008. “Report of the First Intersessional RMP Workshop on North Atlantic Fin Whales.” Report 3. International Whaling Commission.
Kell, L T, I Mosqueira, P Grosjean, J M Fromentin, D Garcia, R Hillary, E Jardim, et al. 2007. “FLR: an open-source framework for the evaluation and development of management strategies.” ICES Journal of Marine Science: Journal Du Conseil 64 (4): 640.
Lindstrøm, U, S Smout, D Howell, and B Bogstad. 2009. “Modelling multi-species interactions in the Barents Sea ecosystem with special emphasis on minke whales and their interactions with cod, herring and capelin.” Deep Sea Research Part II: Topical Studies in Oceanography 56 (21-22): 2068–79.
Link, J S, E A Fulton, and R J Gamble. 2010. “The Northeast US Application of ATLANTIS: A full system model exploring marine ecosystem dynamics in a living marine resource management context.” Progress in Oceanography.
Livingston, Patricia A, and Richard D Methot. 1998. “Incorporation of predation into a population assessment model of eastern Bering Sea walleye pollock.” Fishery Stock Assessment Models, 663–78.
Magnusson, Kjartan G. 1995. “An Overview of the Multispecies Vpa—Theory and Applications.” Reviews in Fish Biology and Fisheries 5 (2): 195–212.
Möllmann, Christian, Martin Lindegren, Thorsten Blenckner, Lena Bergström, Michele Casini, Rabea Diekmann, Juha Flinkman, et al. 2013. “Implementing Ecosystem-Based Fisheries Management: From Single-Species to Integrated Ecosystem Assessment and Advice for Baltic Sea Fish Stocks.” ICES Journal of Marine Science 71 (5): 1187–97.
MRI. 1997. “Fjölstofnarannsóknir 1992 - 1995 (Multi–Species Research 1992 – 1995).” Marine Research Institute.
Plagányi, É.E. 2007. Models for an ecosystem approach to fisheries. Food & Agriculture Org.
Plagányi, Éva E, André E Punt, Richard Hillary, Elisabetta B Morello, Olivier Thébaud, Trevor Hutton, Richard D Pillans, et al. 2014. “Multispecies Fisheries Management and Conservation: Tactical Applications Using Models of Intermediate Complexity.” Fish and Fisheries 15 (1): 1–22.
Sinclair, Michael, R Arnason, J Csirke, Z Karnicki, J Sigurjonsson, H Rune Skjoldal, and G Valdimarsson. 2002. “Responsible Fisheries in the Marine Ecosystem.” Fisheries Research 58 (3): 255–65.
Stefánsson, G, and Ó K Pálsson. 1997. “BORMICON. boreal migration and consumption model.” Marine Research Institute Report. 58. 223 P.
Taylor, LA. 2011. “Gadget Models of Cod–Shrimp Interactions in Icelandic Waters.” Technical Report RH–03–2011, Science Institute, University of Iceland.
Taylor, L., J. Begley, V. Kupca, and G. Stefansson. 2007. “A simple implementation of the statistical modelling framework Gadget for cod in Icelandic waters.” African Journal of Marine Science 29 (2): 223–45.
Taylor, Lorna A, ed. 2004. {F}inal {R}eport: dst$^2$: {D}evelopment of structurally detailed statistically testable models of marine populations. Vol. 118. Marine Research Institute, Reykjavik.
Voss, Rudi, Martin F Quaas, Jörn O Schmidt, and Julia Hoffmann. 2014. “Regional Trade-Offs from Multi-Species Maximum Sustainable Yield (Mmsy) Management Options.” Marine Ecology Progress Series 498: 1–12.