Plot stock distribution
plot_stockdist.RdPlots proportions of stocks by length or age in fit$stockdist
Usage
plot_stockdist(
  fit,
  stocks = NULL,
  name = NULL,
  type = "step",
  show_intervals = FALSE,
  color_palette = "default",
  base_size = 8
)
Arguments
- fit
A gadget fit object. See
g3_fit.- stocks
Character vector specifying the stock to plot in
fit. IfNULL, all stocks are plotted in a single plot. If"separate", all stocks are plotted in separate plots.- name
Character vector specifying the likelihood component to plot in
unique(fit$stockdist$name). IfNULL, all components are plotted as a list.- type
Character specifying the plot type:
"step"uses stepwise lines to show the aggregation intervals."line"uses lines through average values between lower and upper intervals. If you want to show the aggregation intervals and to use average values (i.e. smooth lines), use theshow_intervalsargument.- show_intervals
Logical indicating whether length intervals should be plotted.
- color_palette
A function defining the color palette or a vector of colors to be used for stocks.
- base_size
Base size parameter for ggplot. See ggtheme.
Value
A ggplot object or a list of such objects depending on the stocks argument.
Details
Plots model fit to data using likelihoods. Separate plot for each unique(fit$stockdist$name).
Examples
data(fit)
# Only one dataset to save space:
plot_stockdist(fit, name = "EggaN_matp")
#> $EggaN_matp
#> Warning: Removed 252 rows containing missing values or values outside the scale range
#> (`geom_step()`).
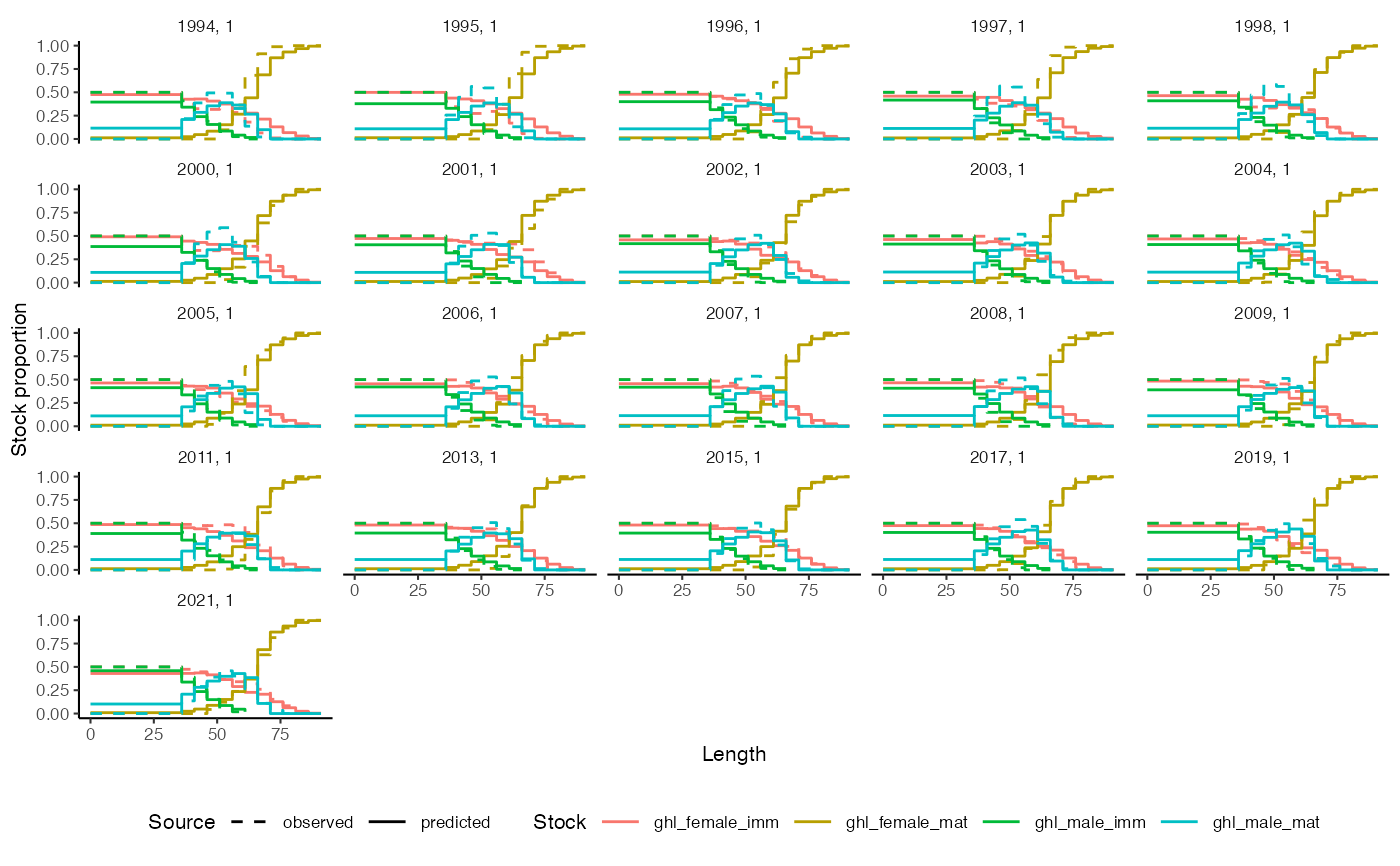 #>
plot_stockdist(fit, name = "EggaN_matp", stocks = "separate",
color_palette = NULL)
#> Warning: Removed 252 rows containing missing values or values outside the scale range
#> (`geom_step()`).
#> $EggaN_matp
#>
plot_stockdist(fit, name = "EggaN_matp", stocks = "separate",
color_palette = NULL)
#> Warning: Removed 252 rows containing missing values or values outside the scale range
#> (`geom_step()`).
#> $EggaN_matp
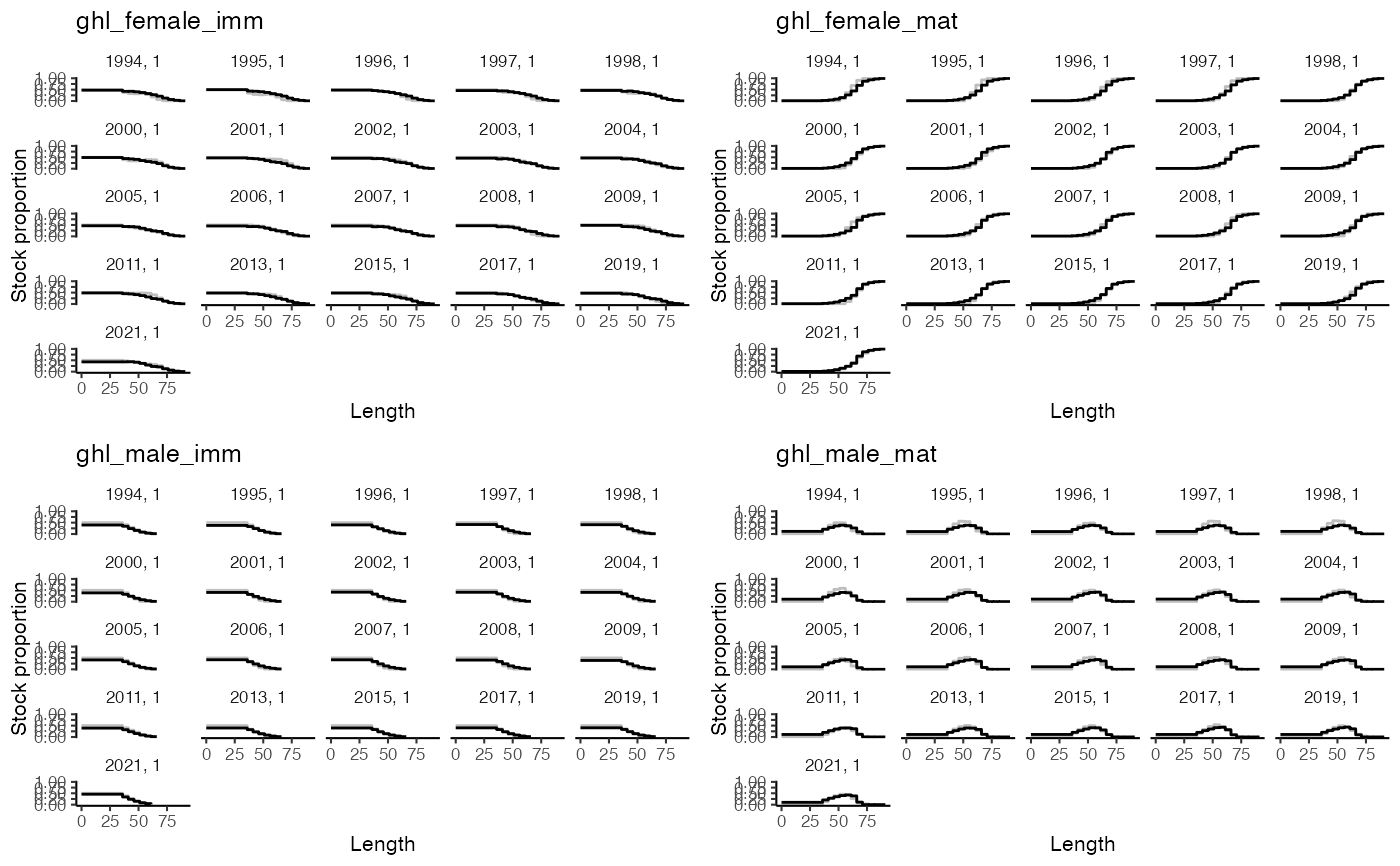 #>
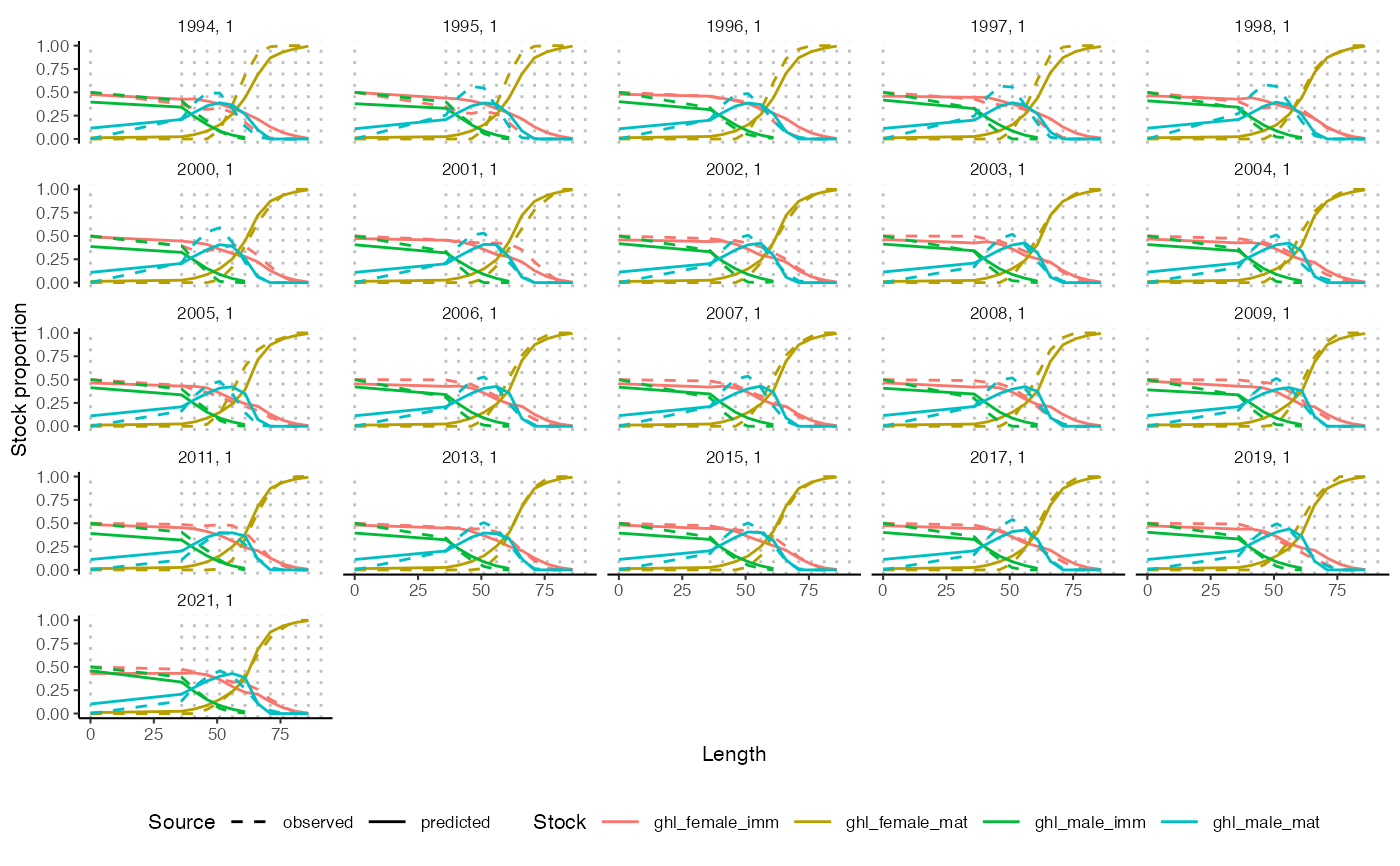
plot_stockdist(fit, name = "EggaN_matp", type = "line", show_intervals = TRUE)
#> $EggaN_matp
#> Warning: Removed 210 rows containing missing values or values outside the scale range
#> (`geom_line()`).
#>
plot_stockdist(fit, name = "EggaN_matp", type = "line", show_intervals = TRUE)
#> $EggaN_matp
#> Warning: Removed 210 rows containing missing values or values outside the scale range
#> (`geom_line()`).
 #>
#>