Plot model stock composition
plot_stockcomp.RdPlots proportions of stocks in the model by length or age
Arguments
- fit
A gadget fit object. See
g3_fit.- type
Character specifying the plot type. Options: "line" or "area". See examples.
- by_age
Logical indicating whether age should be used on the x-axis instead of length
- base_size
Base size parameter for ggplot. See ggtheme.
Value
A ggplot object or a list of such objects depending on the type argument.
Examples
data(fit)
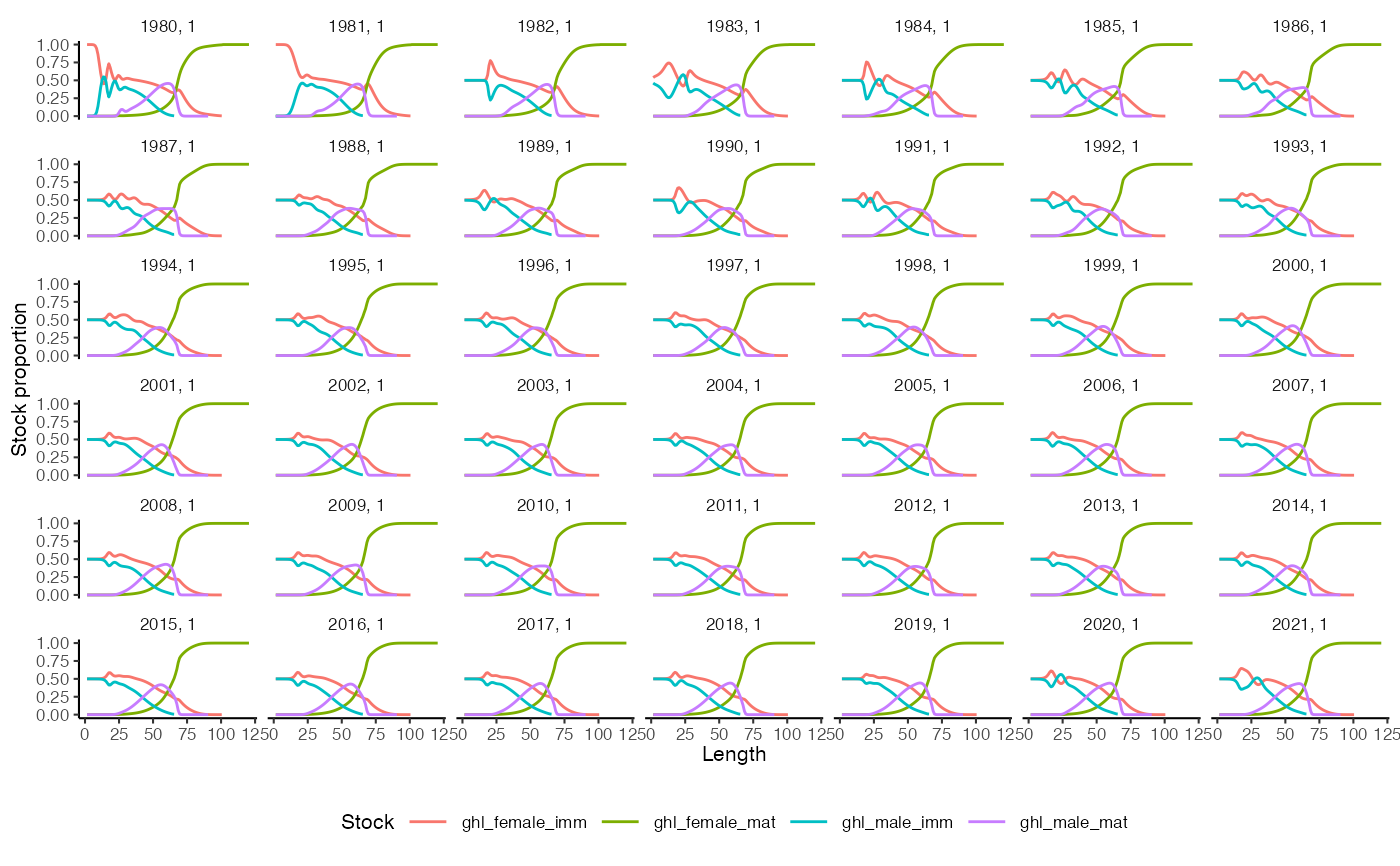
plot_stockcomp(fit)
#> Ignoring unknown labels:
#> • fill : "Stock"
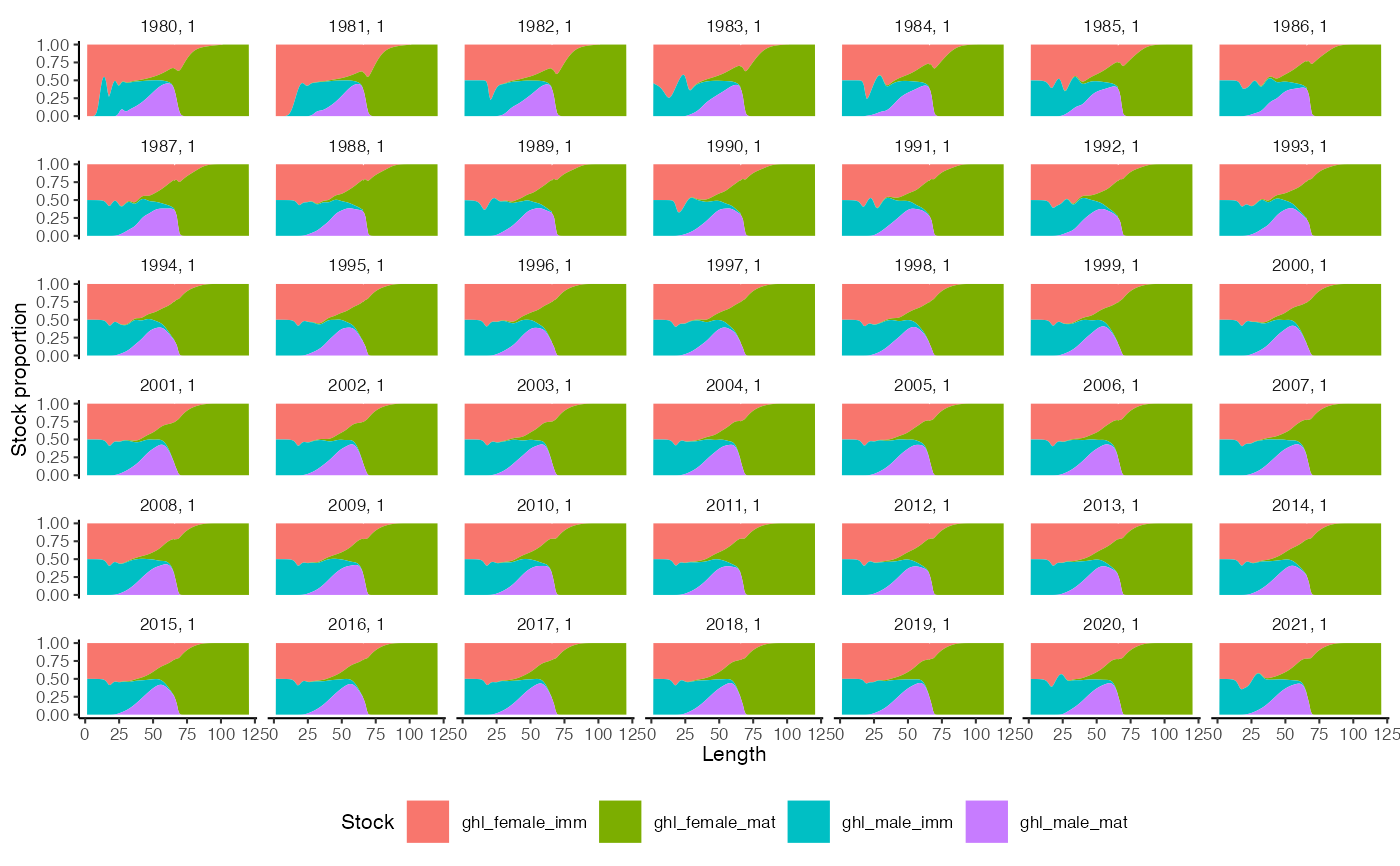
 plot_stockcomp(fit, type = "area")
#> Ignoring unknown labels:
#> • colour : "Stock"
plot_stockcomp(fit, type = "area")
#> Ignoring unknown labels:
#> • colour : "Stock"
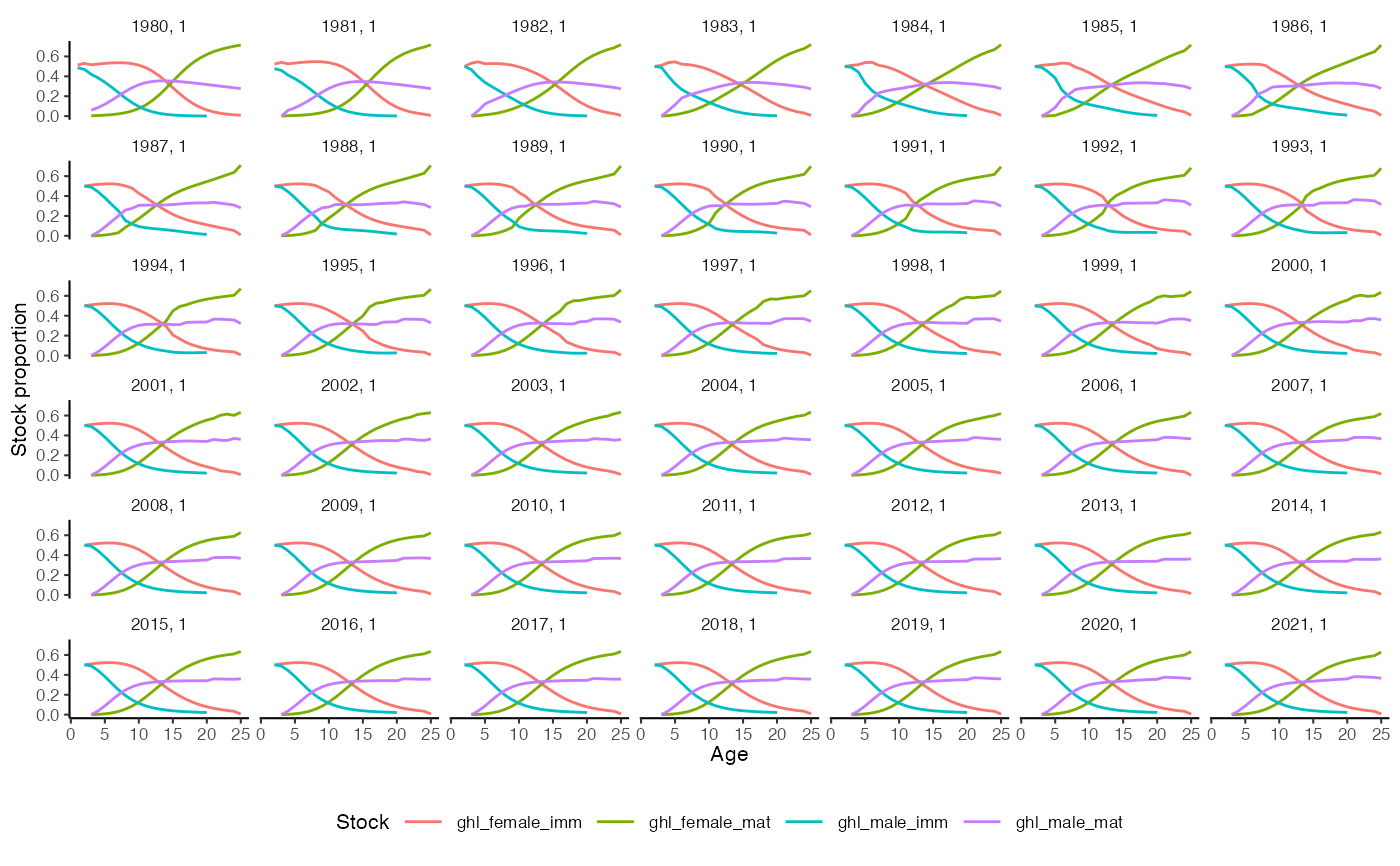
 plot_stockcomp(fit, by_age = TRUE)
#> Ignoring unknown labels:
#> • fill : "Stock"
#> Warning: Removed 82 rows containing missing values or values outside the scale range
#> (`geom_line()`).
plot_stockcomp(fit, by_age = TRUE)
#> Ignoring unknown labels:
#> • fill : "Stock"
#> Warning: Removed 82 rows containing missing values or values outside the scale range
#> (`geom_line()`).