Plot likelihood summary
plot_likelihood.RdPlot likelihood summary
Usage
plot_likelihood(
fit,
type = "total",
log_scale = FALSE,
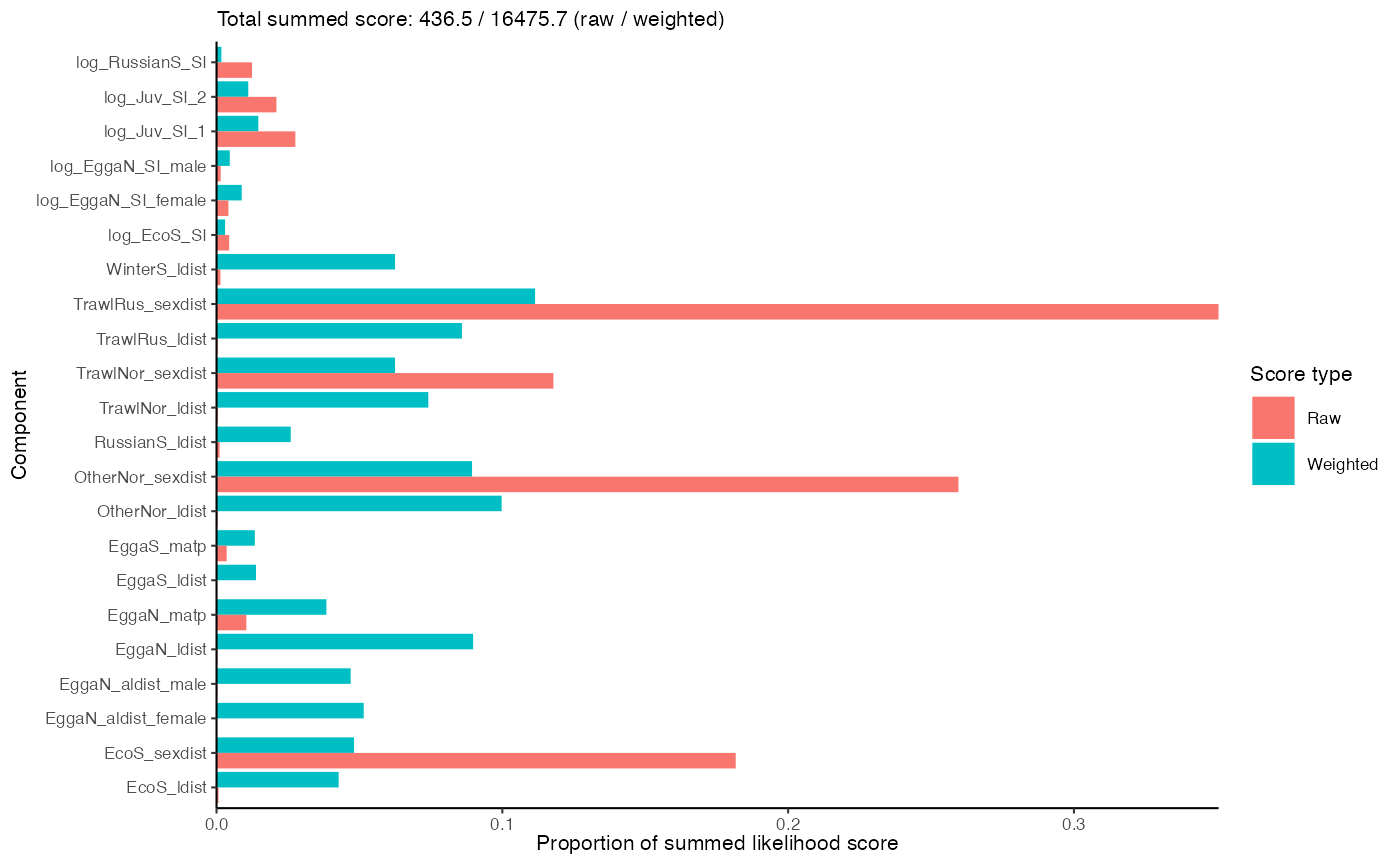
use_proportions = TRUE,
base_size = 8
)Arguments
- fit
A gadget fit object. See
g3_fit.- type
Character specifying the plot type. Options:
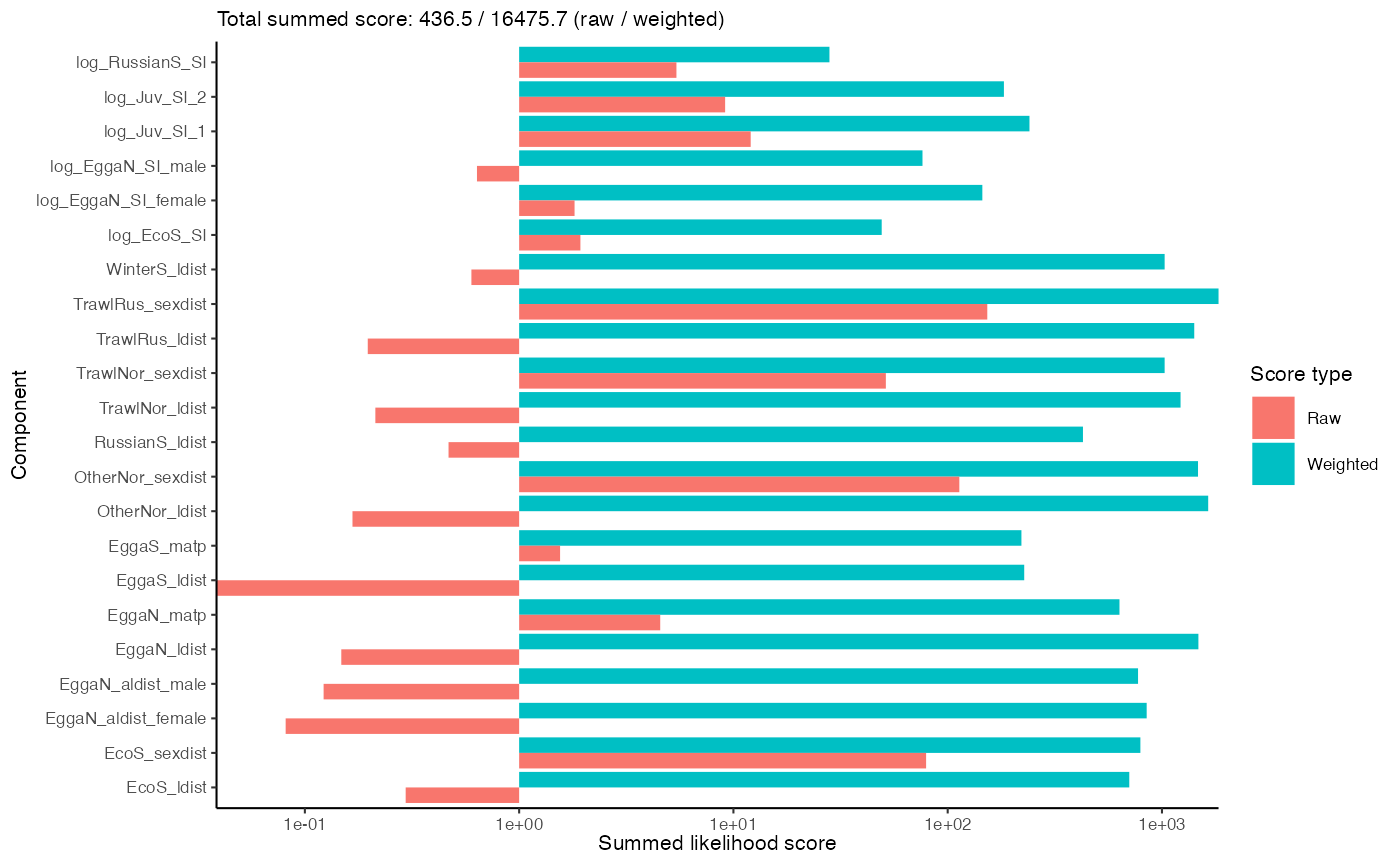
"direct","weighted"or"total". See Details.- log_scale
Logical indicating whether the value axis should be log10 transformed.
- use_proportions
Logical indicating whether proportions of summed likelihood scores should be used instead of summed likelihood score values when
type = "total".- base_size
Base size parameter for ggplot. See ggtheme.
Value
A ggplot object.
Details
Possible plot types are:
- direct
Plots direct comparisons of data with model output.
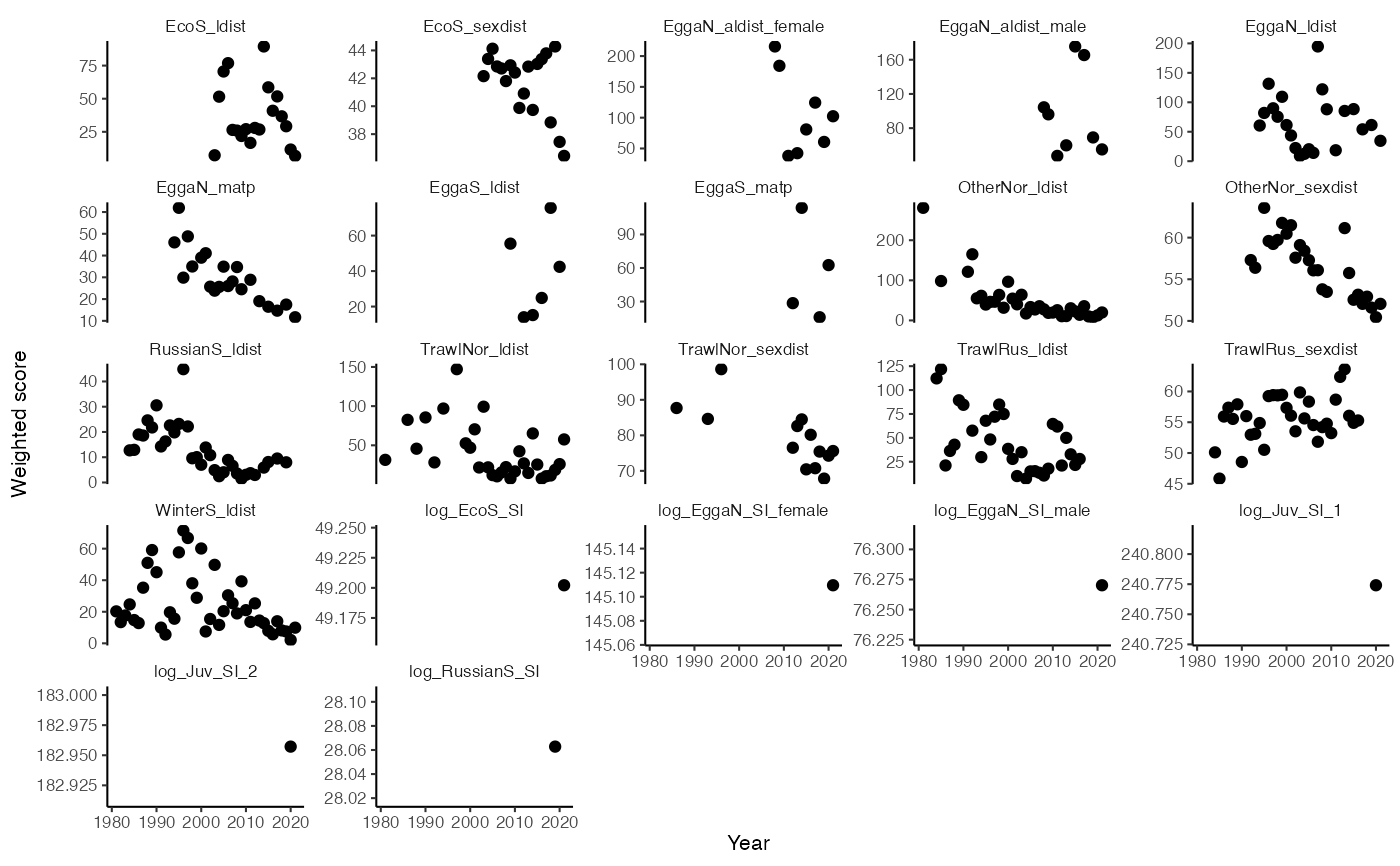
- weighted
Plots the weighted likelihood value for each component.
- total (or any other string)
Plots the sums of weighted and raw likelihood values by component.
Examples
data(fit)
plot_likelihood(fit)

plot_likelihood(fit, use_proportions = FALSE, log_scale = TRUE)

plot_likelihood(fit, type = "weighted")