Plot model length distributions for stocks by year
plot_ldist.RdPlot model length distributions for stocks by year
Usage
plot_ldist(
  fit,
  type = "line",
  by_age = FALSE,
  stocks = NULL,
  scales = "fixed",
  ncol = NULL,
  years = NULL,
  base_size = 8
)
Arguments
- fit
A gadget fit object. See
g3_fit.- type
Character specifying the plot type. Options:
"line","bar", or"ggridges".- by_age
Logical indicating whether the length distributions should be grouped by age. Works only with
type = "line".- stocks
Character specifying the substock to plot in
fit. IfNULL, all stocks are plotted.- scales
Character defining the
facet_wrapscalesargument to use.- ncol
Number of columns passed to
facet_wrap- years
Numeric vector defining which years to plot. If
NULL(default), all years are plotted.- base_size
Base size parameter for ggplot. See ggtheme.
Value
A ggplot object or a list of such objects depending on the type argument.
Details
Do not trust the absolute numbers when by_age = TRUE. They are estimated from normal distributions by using number * dnorm(1:120, mean = mean_length, sd = stddev_length).
Examples
data(fit)
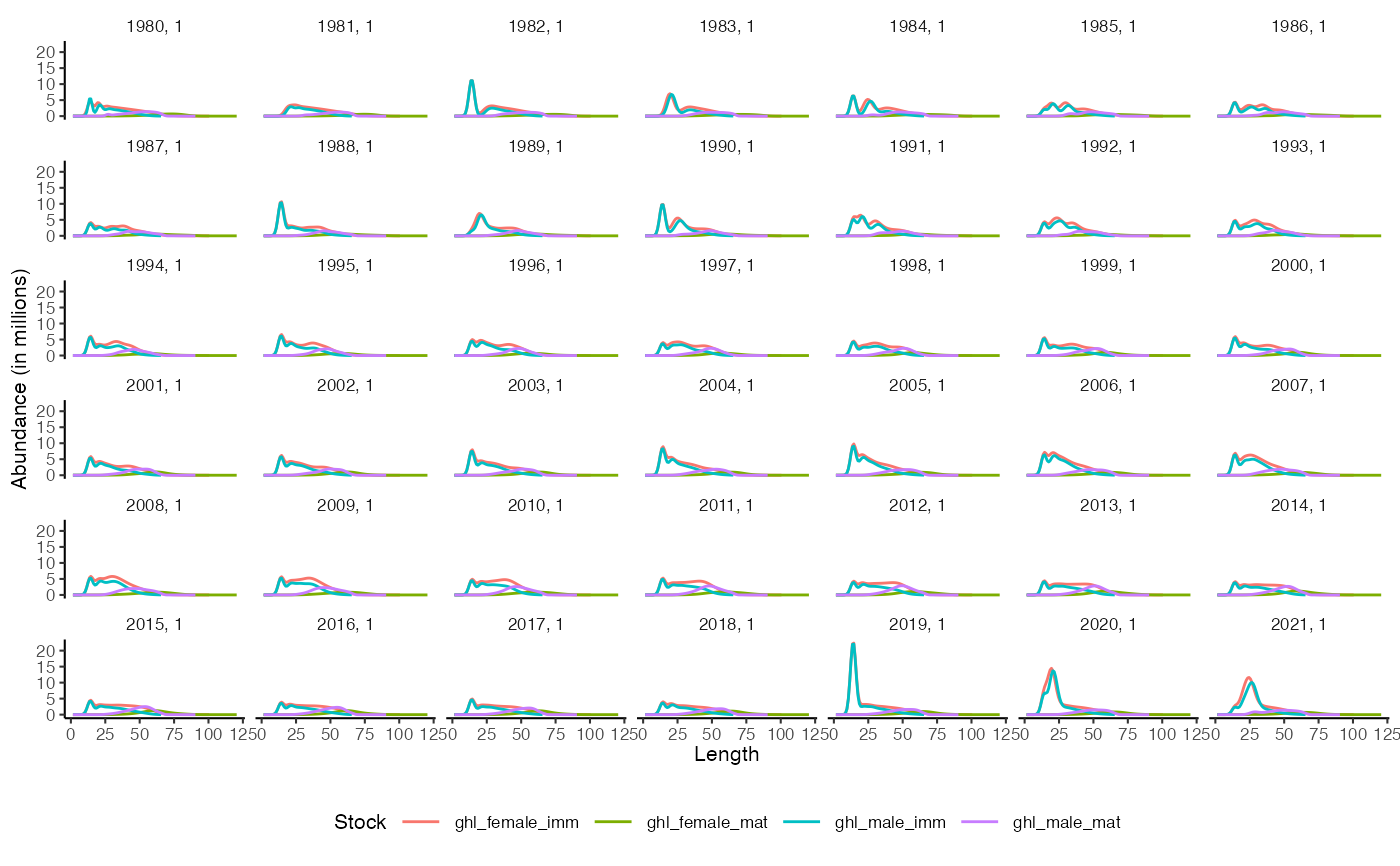
plot_ldist(fit)
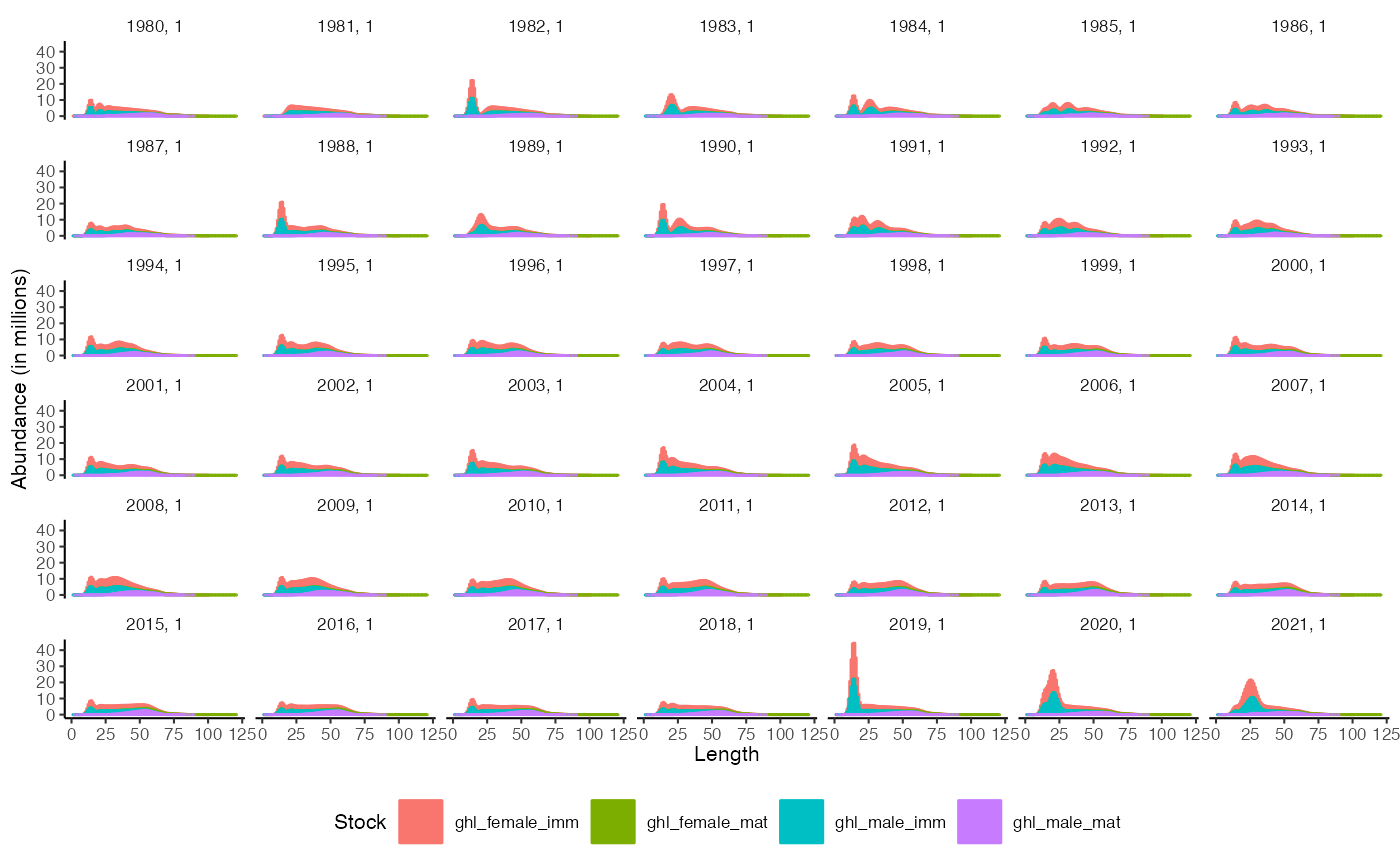
 plot_ldist(fit, type = "bar")
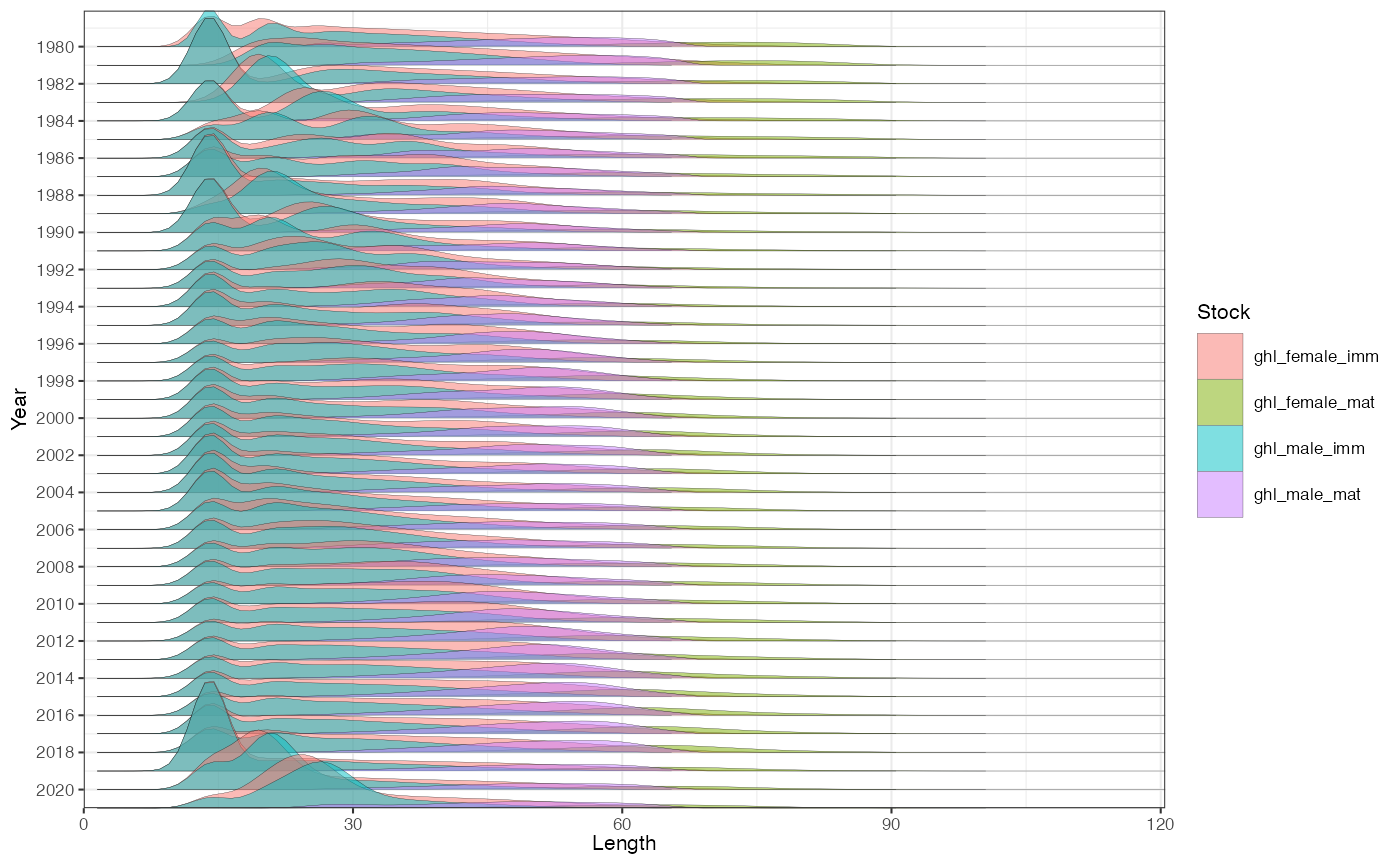
 plot_ldist(fit, type = "ggridges")
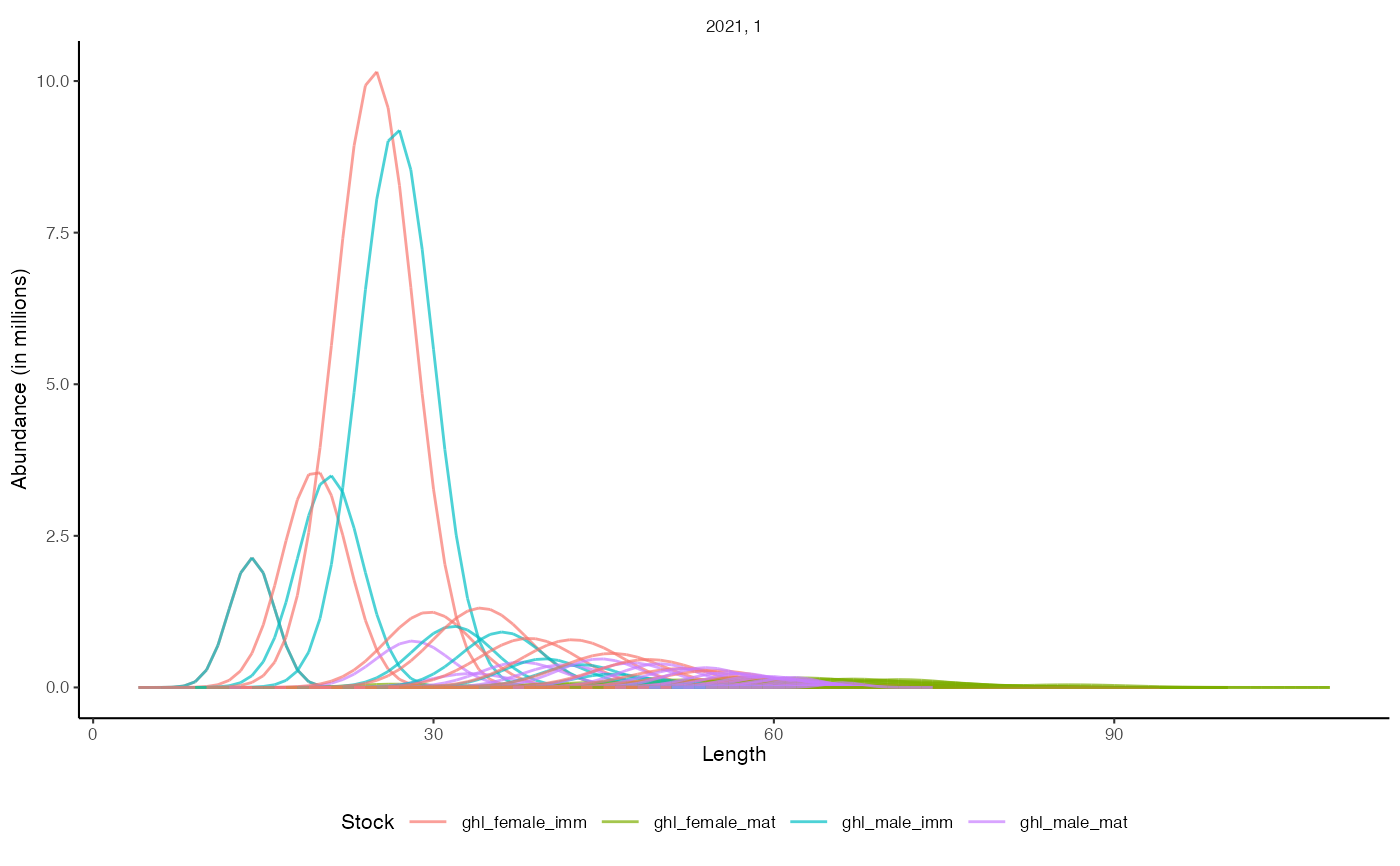
 plot_ldist(fit, by_age = TRUE, years = 2021)