Plot of average growth for each stock
plot_growth.RdPlot of average growth for each stock
Arguments
- fit
A gadget fit object. See
g3_fit.- type
Character specifying the plot type. Options:
"annual","mean"or"stdev". See Details.- stdev
Logical indicating whether standard deviation should be shown on both sides of mean for plots that use mean lengths.
- add_models
Logical indicating whether growth models extracted from growth parameters should be plotted together with the data. Uses grep and does not always work.
- base_size
Base size parameter for ggplot. See ggtheme.
Value
A ggplot object.
Examples
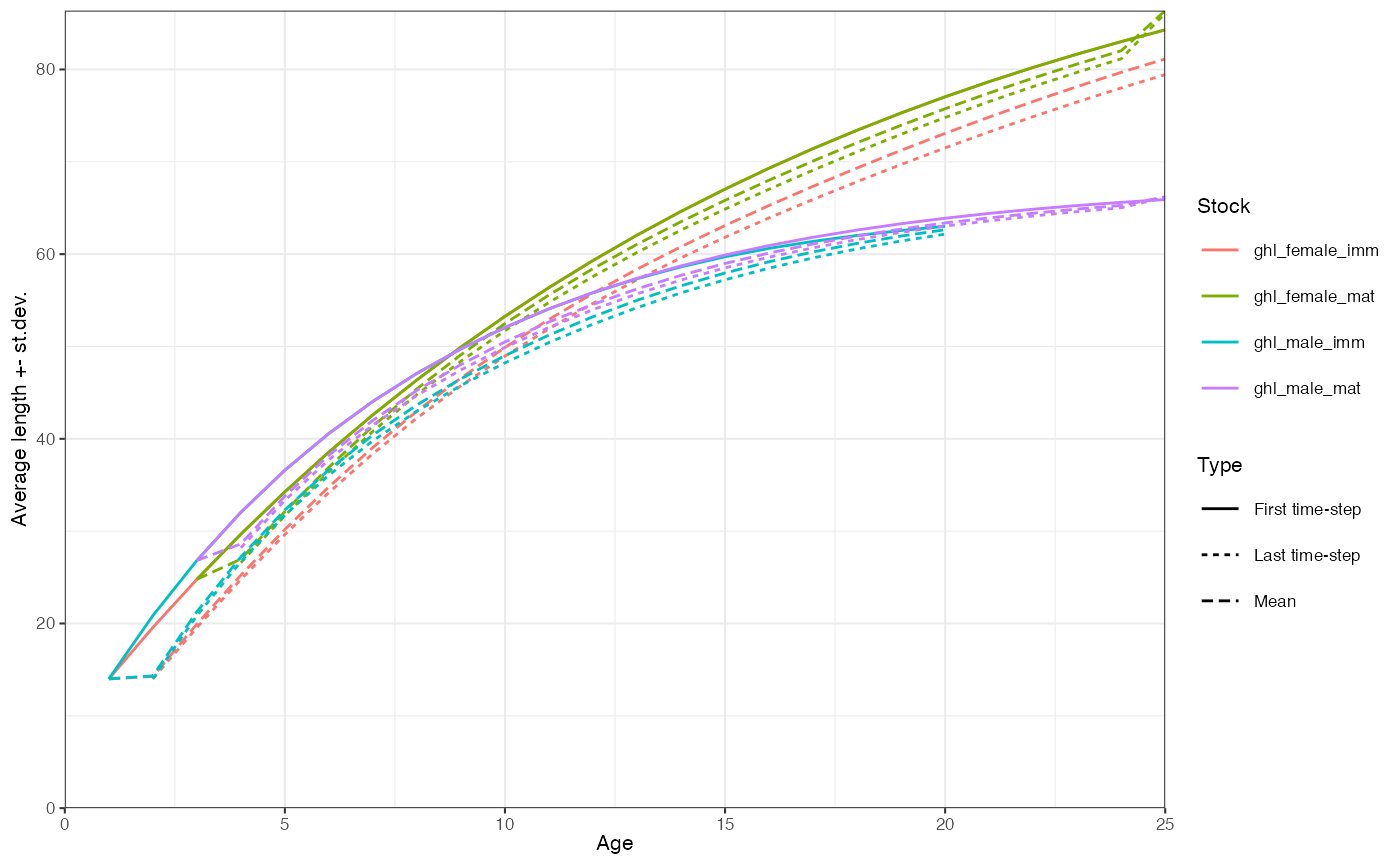
data(fit)
plot_growth(fit)
#> Ignoring unknown labels:
#> • fill : "Stock"
#> • linetype : "Model"
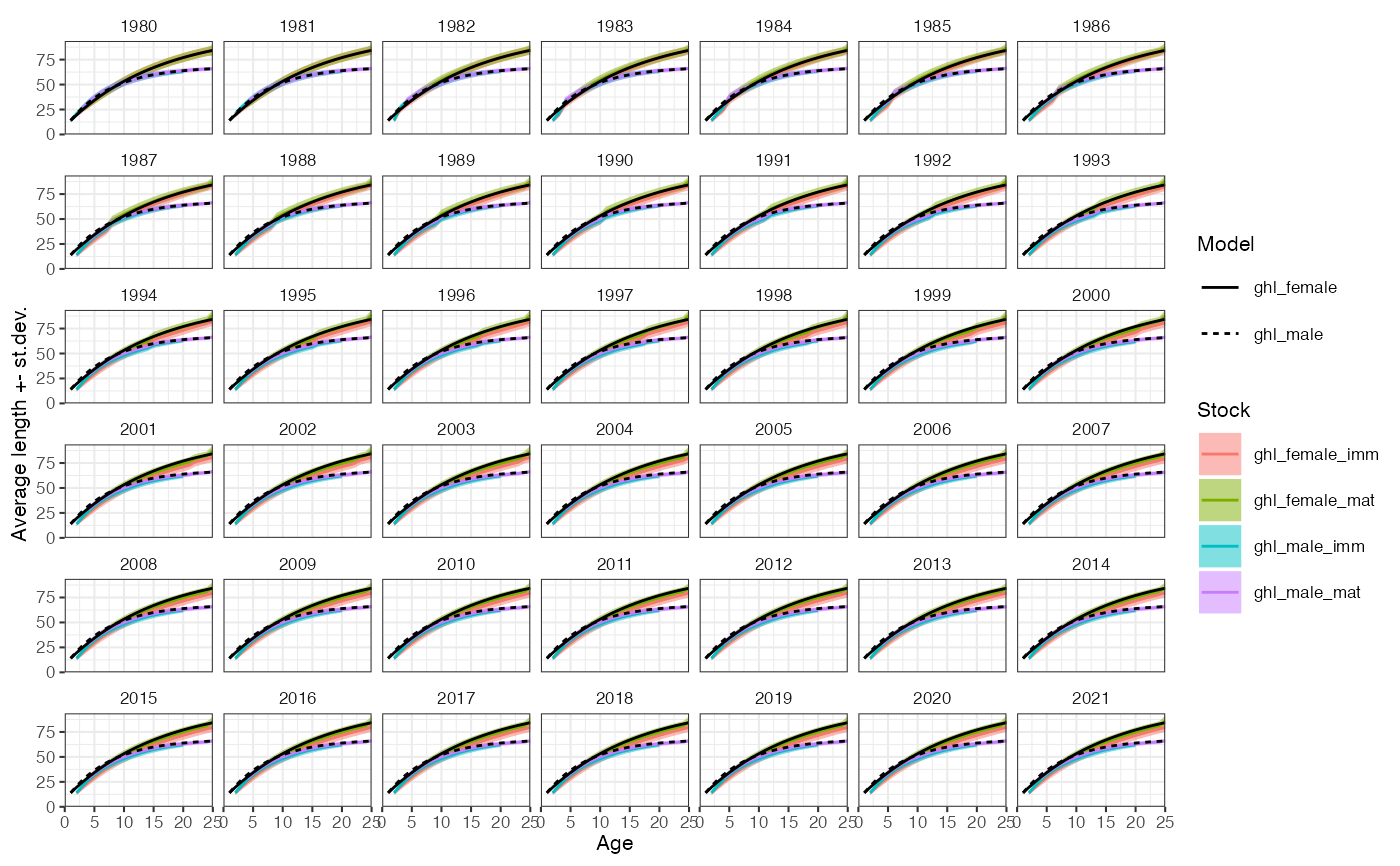
 plot_growth(fit, add_models = TRUE, stdev = TRUE)
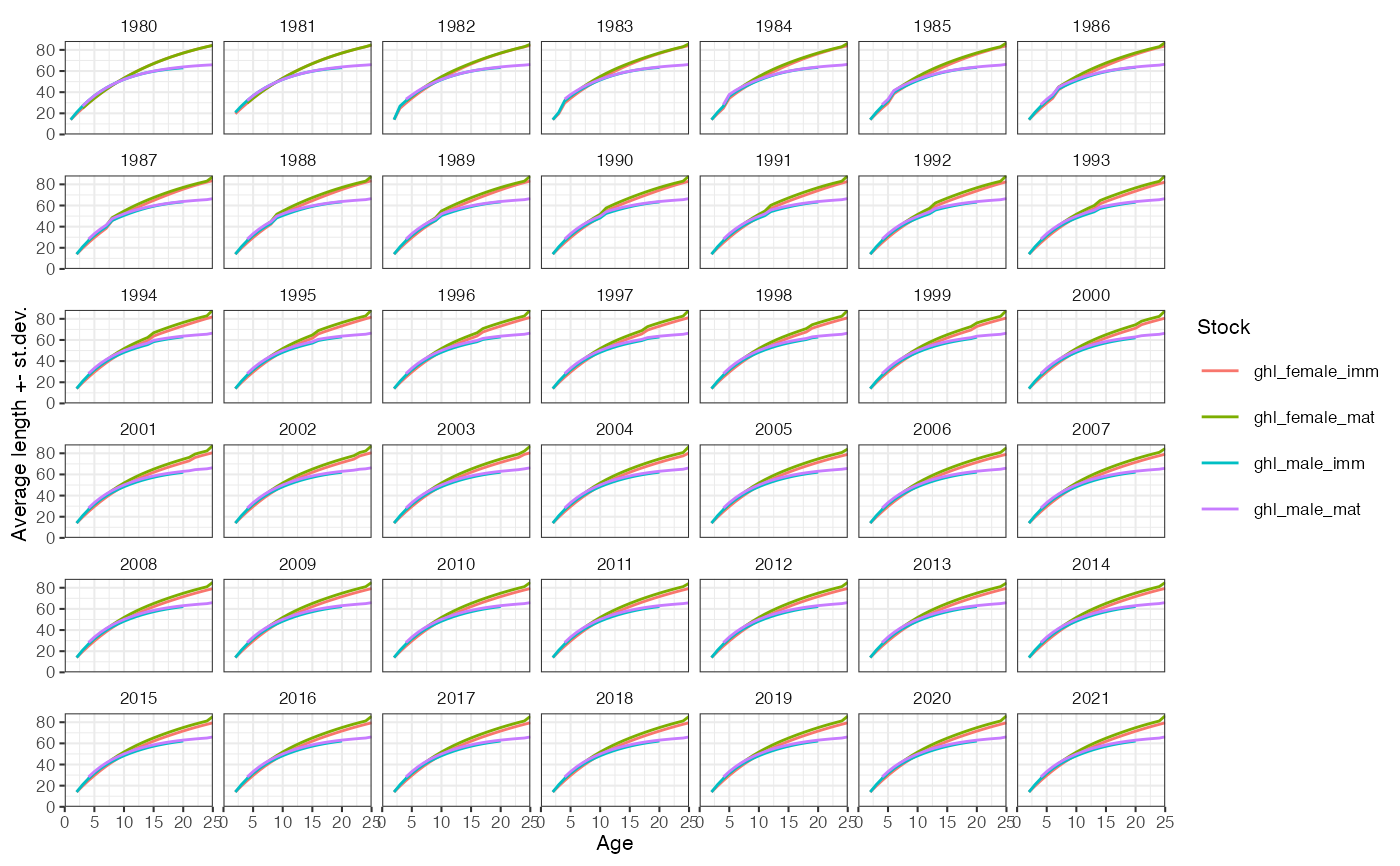
 plot_growth(fit, type = "mean")
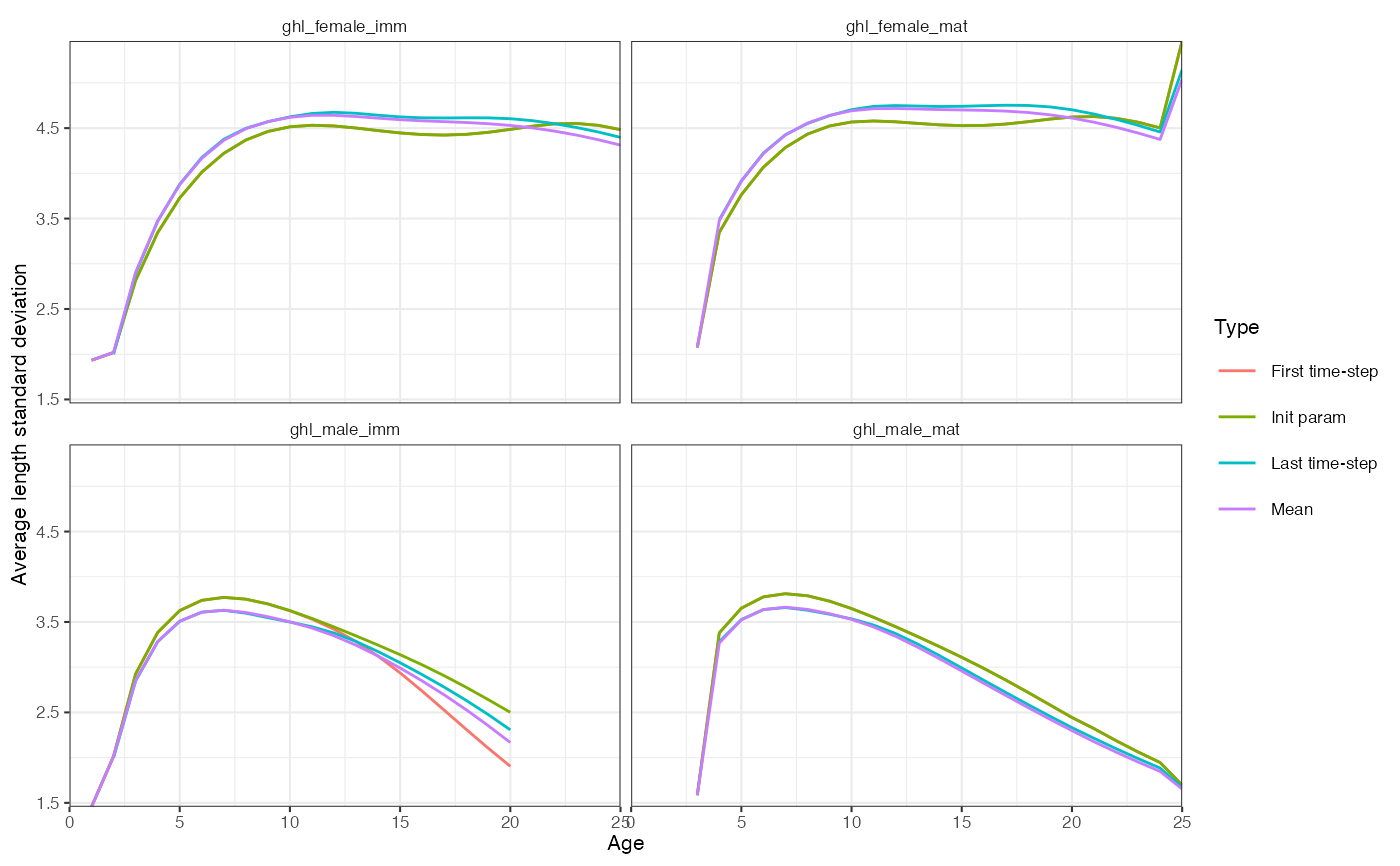
 plot_growth(fit, type = "stdev")