Plot fishing mortality
plot_f.RdPlot fishing mortality
Arguments
- fit
A gadget fit object. See
g3_fit.- stocks
Character specifying the substock to plot in
fit. IfNULL, all stocks are plotted. Not applicable iffbar_agesis defined.- fbar_ages
Either
NULLor a numeric vector of ages to include to calculate Fbar (averaged F over age ranges) for selected ages instead of F for each stock.- return_data
Logical indicating whether to return data for the plot instead of the plot itself.
- base_size
Base size parameter for ggplot. See ggtheme.
Value
A ggplot object.
Details
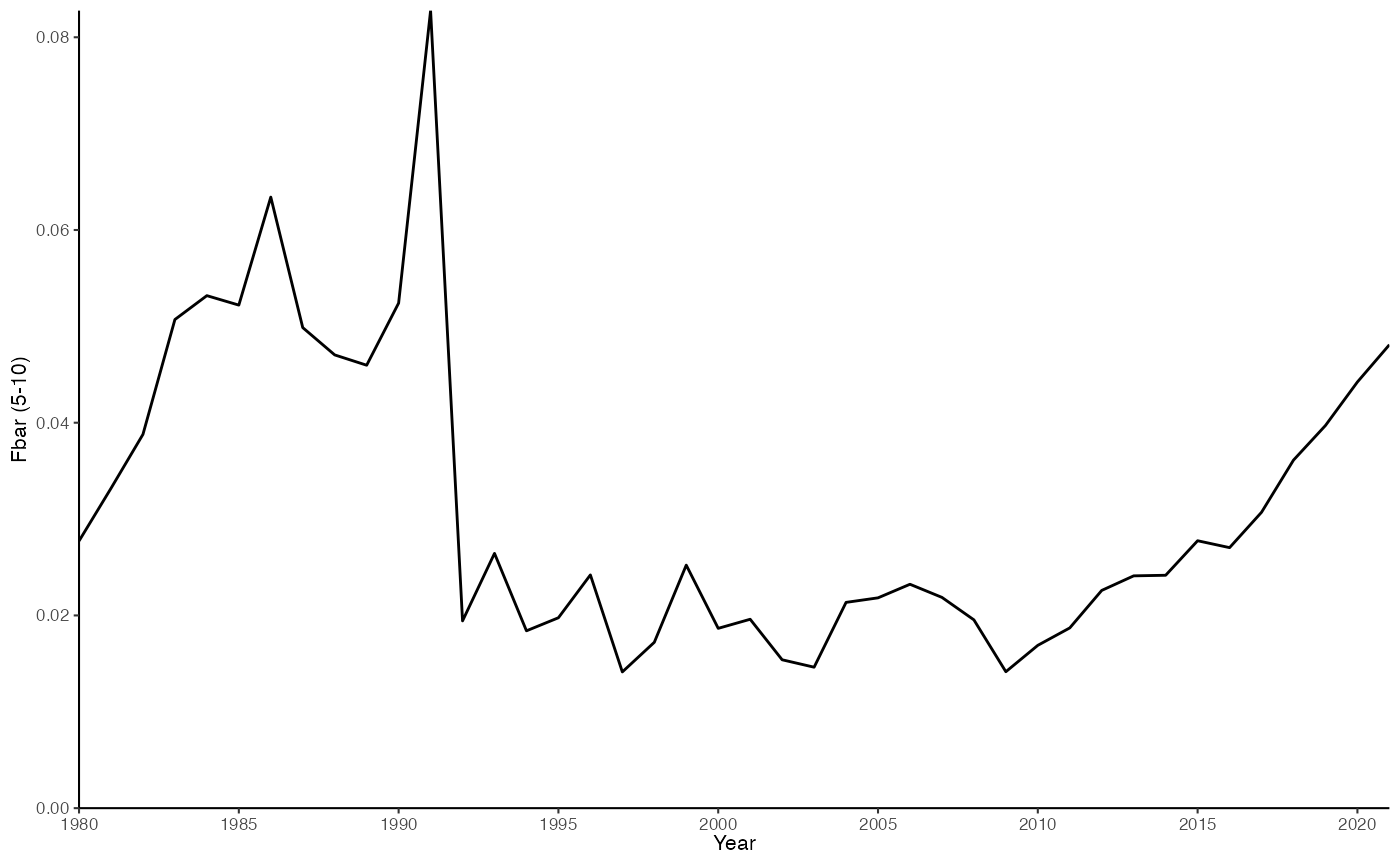
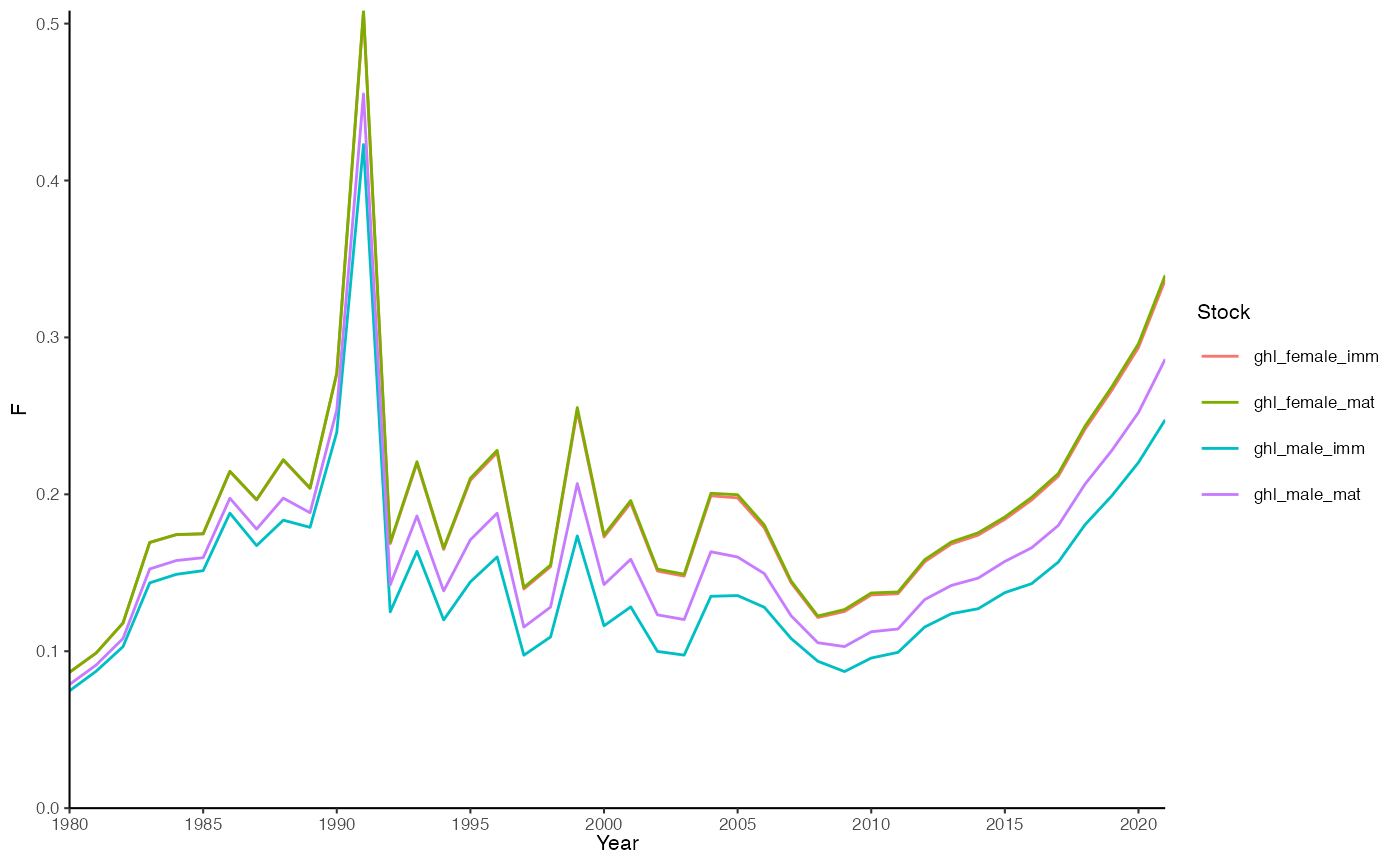
The function calculates either average fishing mortality per substock or average fishing mortality over an age range depending on the fbar_ages argument.
Examples
data(fit)
plot_f(fit)

plot_f(fit, fbar_ages = 5:10)