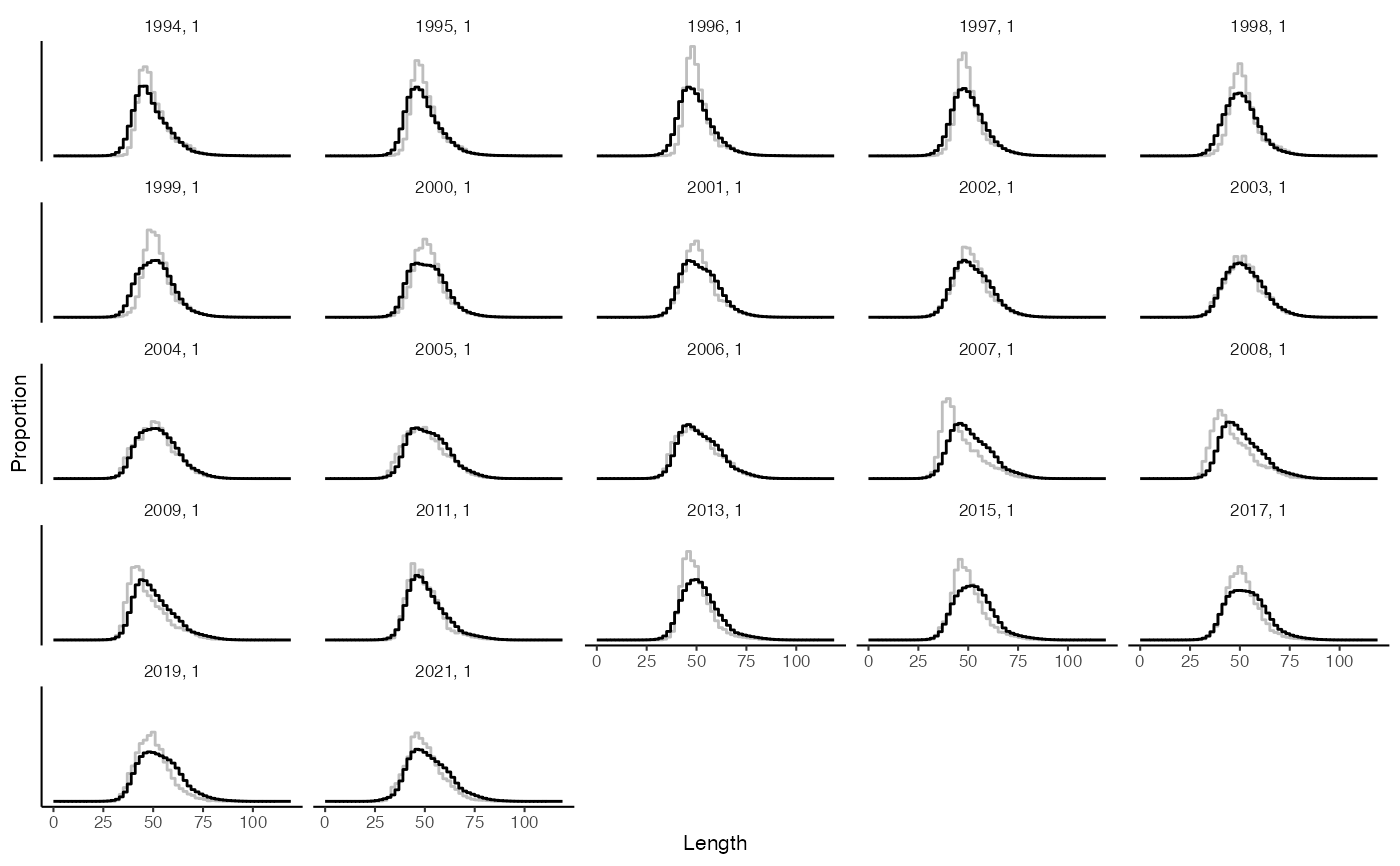
Plot catch distributions
plot_catchdist.RdPlots the length distribution of each fit$catchdist.fleets$name
Arguments
- fit
A gadget fit object. See
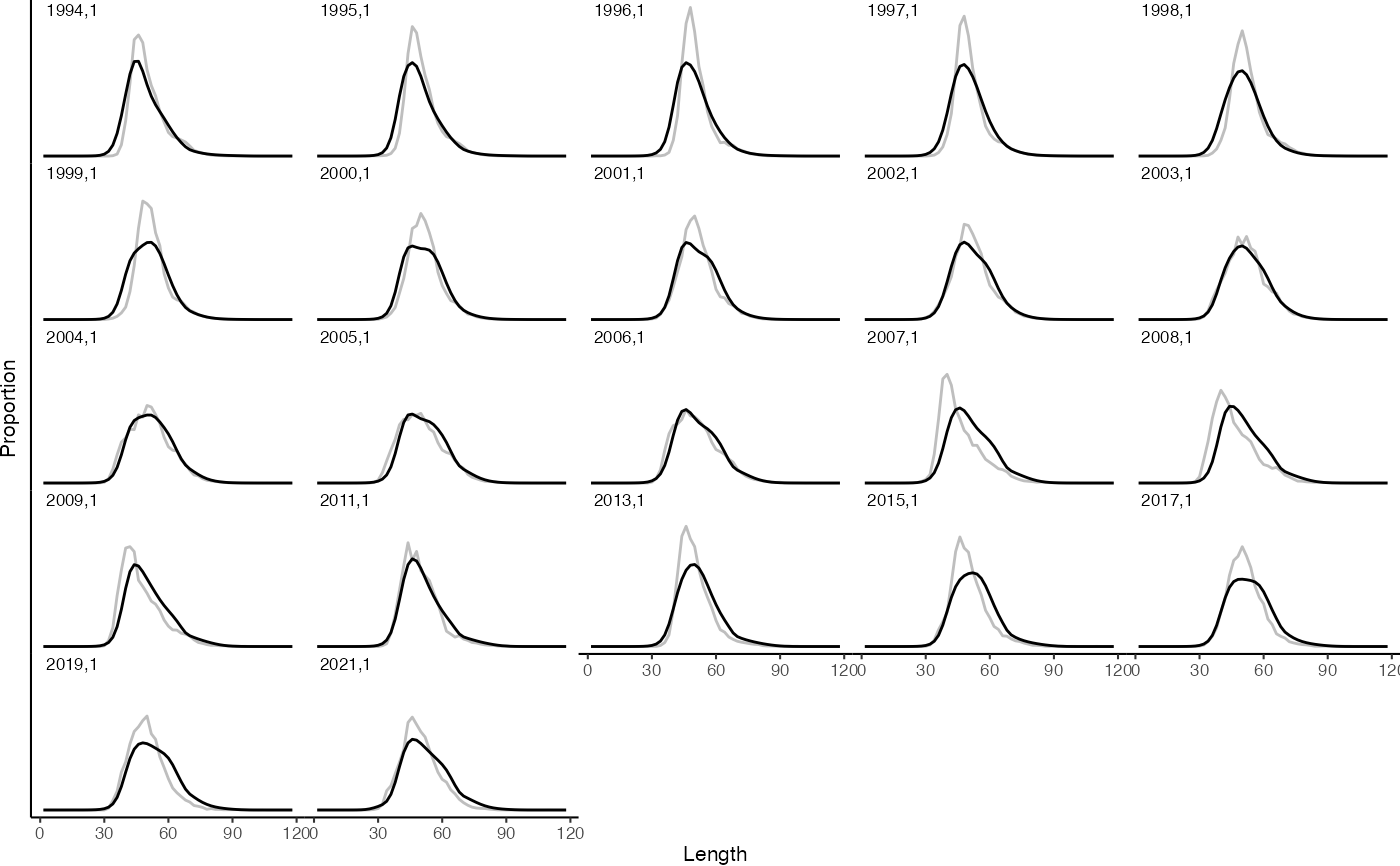
g3_fit.- type
Character specifying the plot type:
"step"uses stepwise lines to show the aggregation intervals."line"uses lines through average values between lower and upper intervals.- name
A character vector specifying the unique(fit$catchdist.fleets$name) to plot. If
NULL, all names with relevant data are plotted.- base_size
Base size parameter for ggplot. See ggtheme.
Value
A list of ggplot objects consisting of a separate plot for each of names.
Examples
data(fit)
# Only one data set to save space:
plot_catchdist(fit, name = "EggaN_ldist")
#> $EggaN_ldist

#>
plot_catchdist(fit, name = "EggaN_ldist", type = "line")
#> $EggaN_ldist

#>
plot_catchdist(fit, name = "EggaN_ldist", type = "line")
#> $EggaN_ldist
 #>
#>