Plot stock biomasses
plot_biomass.RdPlot stock biomasses
Usage
plot_biomass(
fit,
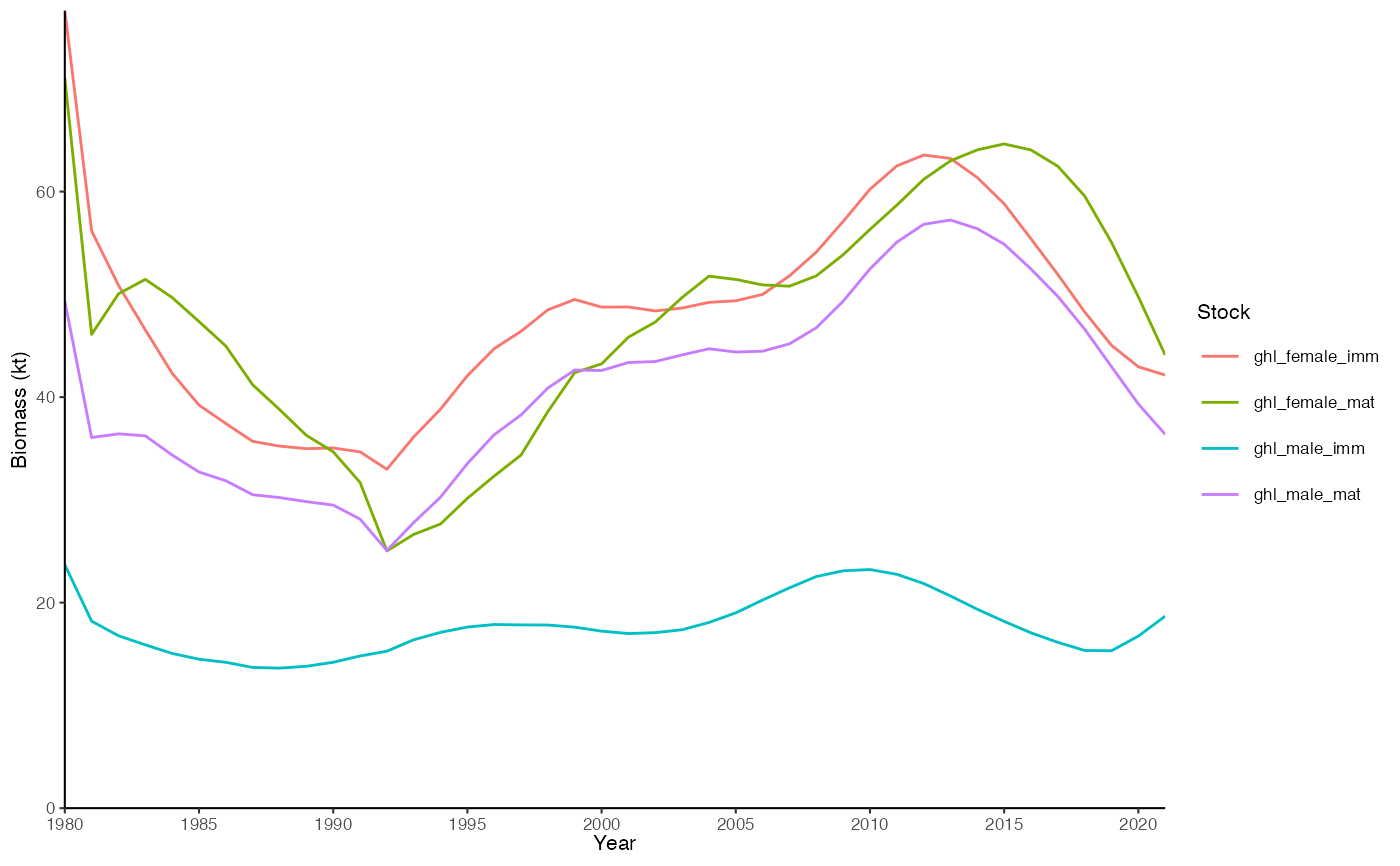
type = "line",
total = FALSE,
biomass = TRUE,
stocks = NULL,
min_catch_length = NULL,
return_data = FALSE,
base_size = 8
)Arguments
- fit
A gadget fit object. See
g3_fit.- type
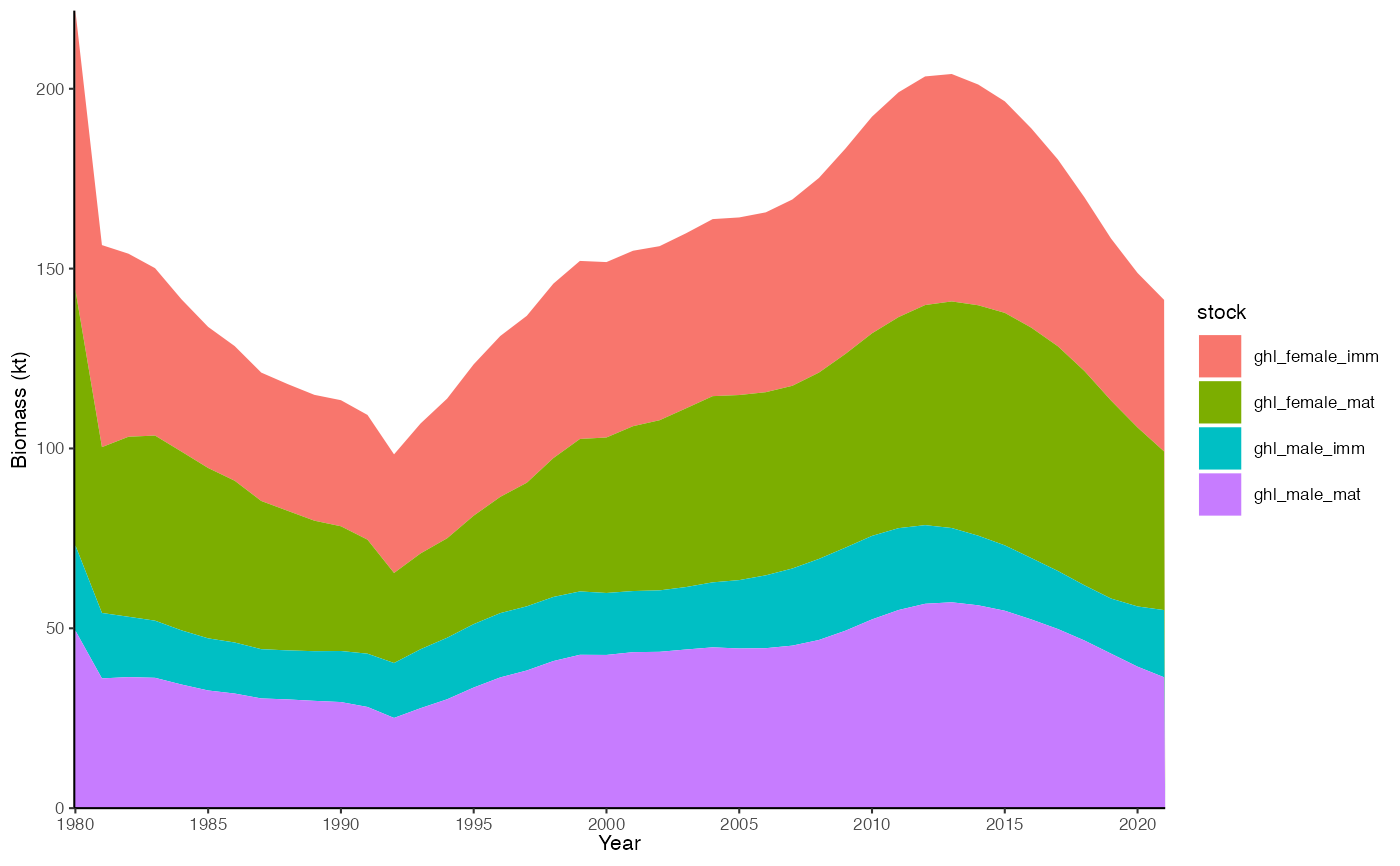
Character specifying the plot type. Options: "line" or "area". See examples.
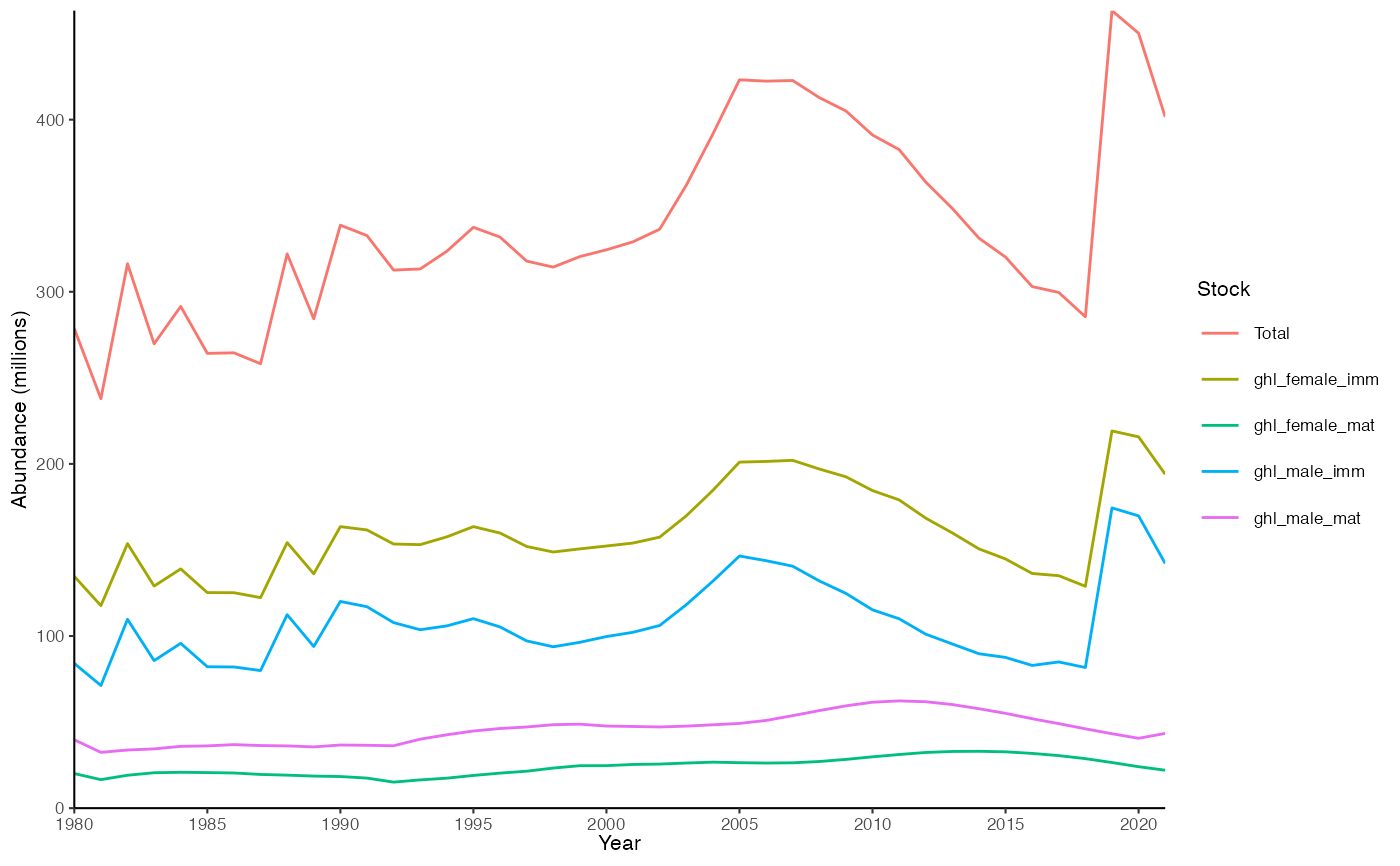
- total
Logical indicating whether total biomass should be plotted. Has no effect if
type = "area".- biomass
Logical indicating whether biomass should be plotted instead of abundance.
- stocks
Character specifying the substock to plot in
fit. IfNULL, all stocks are plotted. Not applicable ifmin_catch_lengthis defined.- min_catch_length
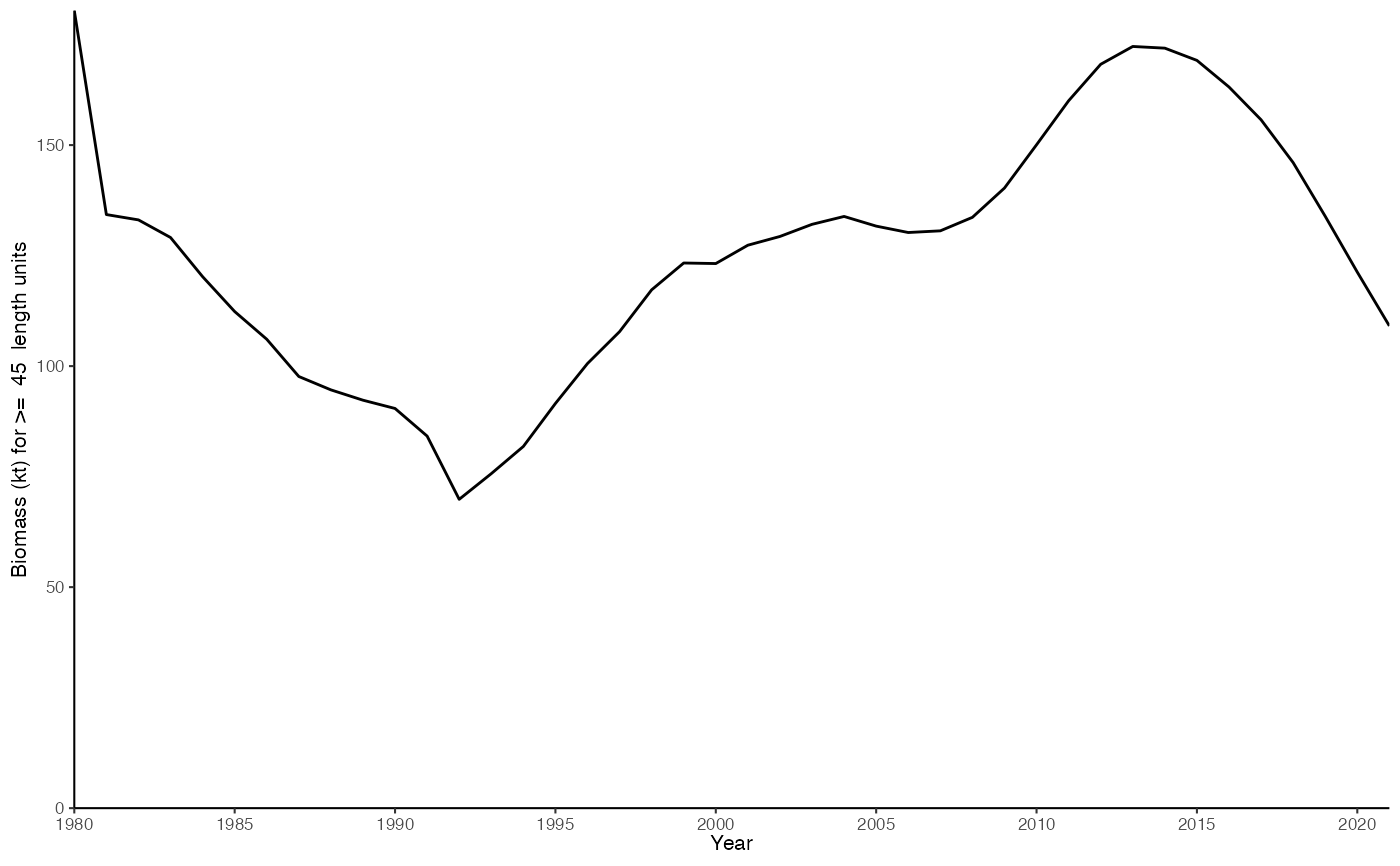
Numeric value defining the minimum catch length (size), which will be used to filter (
>=) the model population before calculating biomass. Combines all stocks. Turn of by setting toNULL(default).- return_data
Logical indicating whether to return data for the plot instead of the plot itself.
- base_size
Base size parameter for ggplot. See ggtheme.
Value
A ggplot object.
Examples
data(fit)
plot_biomass(fit)
 plot_biomass(fit, biomass = FALSE, total = TRUE)
 plot_biomass(fit, type = "area")
#> Ignoring unknown labels:
#> • colour : "Stock"
plot_biomass(fit, type = "area")
#> Ignoring unknown labels:
#> • colour : "Stock"
 plot_biomass(fit, min_catch_length = 45)
#> Ignoring unknown labels:
#> • colour : "Stock"
plot_biomass(fit, min_catch_length = 45)
#> Ignoring unknown labels:
#> • colour : "Stock"