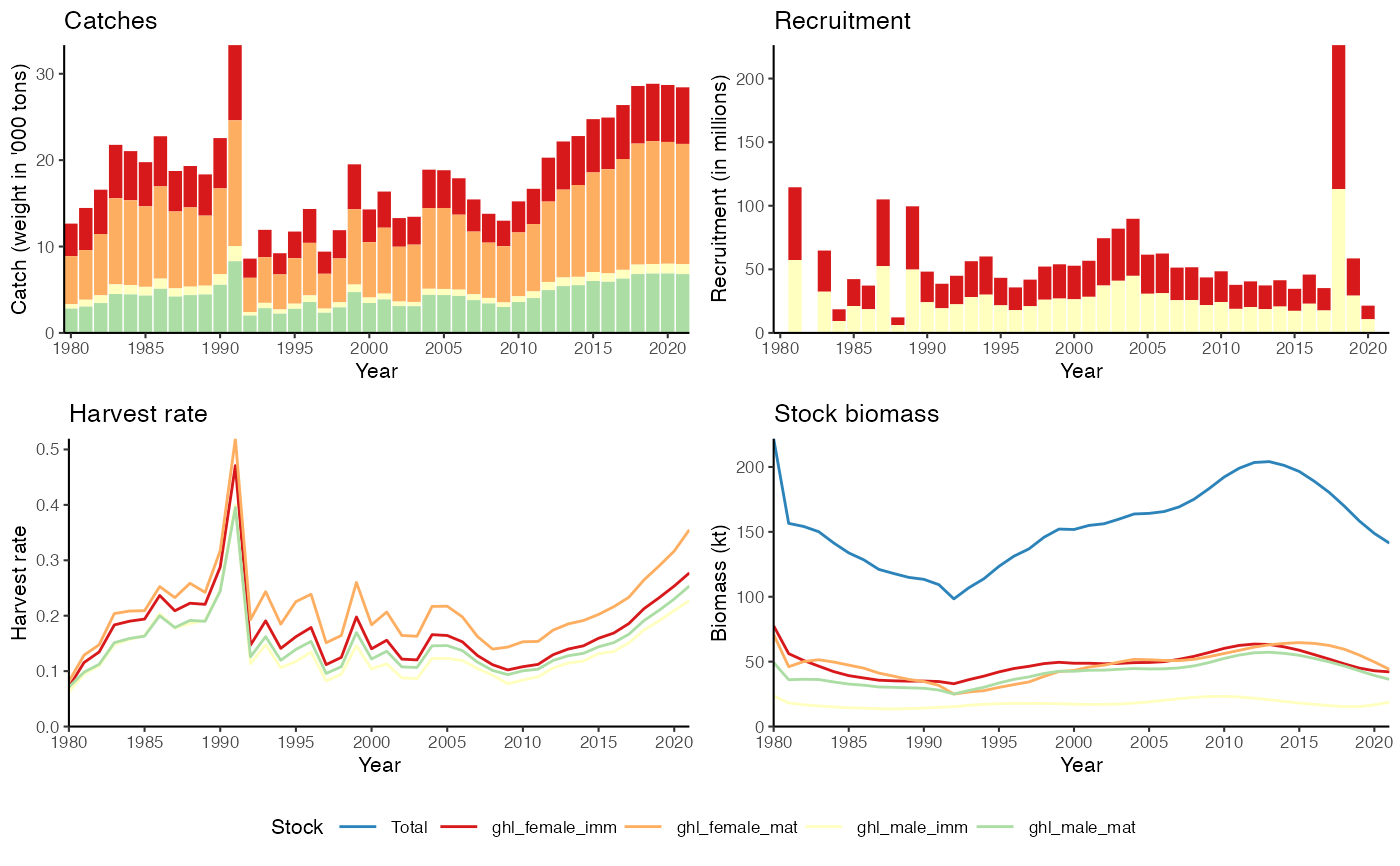
Plot annual ICES type of graphic returning central model data
plot_annual.RdPlot annual ICES type of graphic returning central model data
Usage
plot_annual(
  fit,
  harvest_rate = TRUE,
  color_palette = scales::hue_pal(),
  base_size = 8,
  ...
)
Arguments
- fit
A gadget fit object. See
g3_fit.- harvest_rate
A Logical value, if
TRUEthe harvest rate will be plotted, ifFALSEthe fishing mortality will be plotted.- color_palette
A function defining the color palette to be used or a vector of colors which is 1 longer than the number of stocks in the model. The extra color will be used for total estimate. See scale_color_manual.
- base_size
Base size parameter for ggplot. See ggtheme.
- ...
Additional arguments passed to
plot_*functions.
Value
A ggplot object. If fleet = NULL, a list of ggplot objects.
Examples
data(fit)
# Annual plot with custom colors
plot_annual(fit, color_palette = scales::brewer_pal(palette = "Spectral"))