Plot model age distributions for stocks by year
plot_adist.RdPlot model age distributions for stocks by year
Arguments
- fit
A gadget fit object. See
g3_fit.- type
Character specifying the plot type. Options:
"line","bar"or"ggridges". See examples.- scales
Character defining the
facet_wrapscalesargument to use.- ncol
Number of columns passed to
facet_wrap- years
Numeric vector defining which years to plot. If
NULL(default), all years are plotted.- base_size
Base size parameter for ggplot. See ggtheme.
Value
A ggplot object or a list of such objects depending on the type argument.
Examples
data(fit)
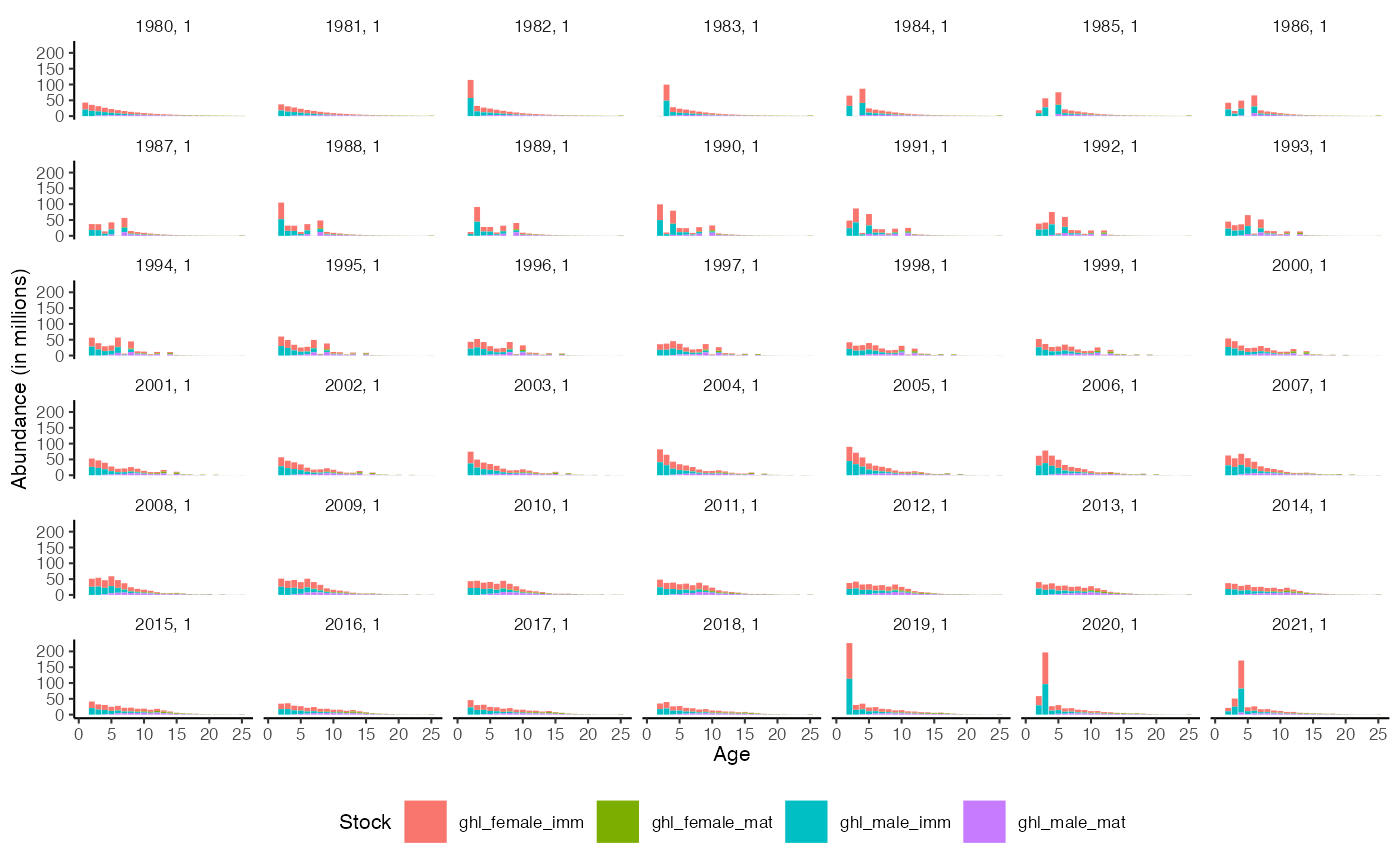
plot_adist(fit)
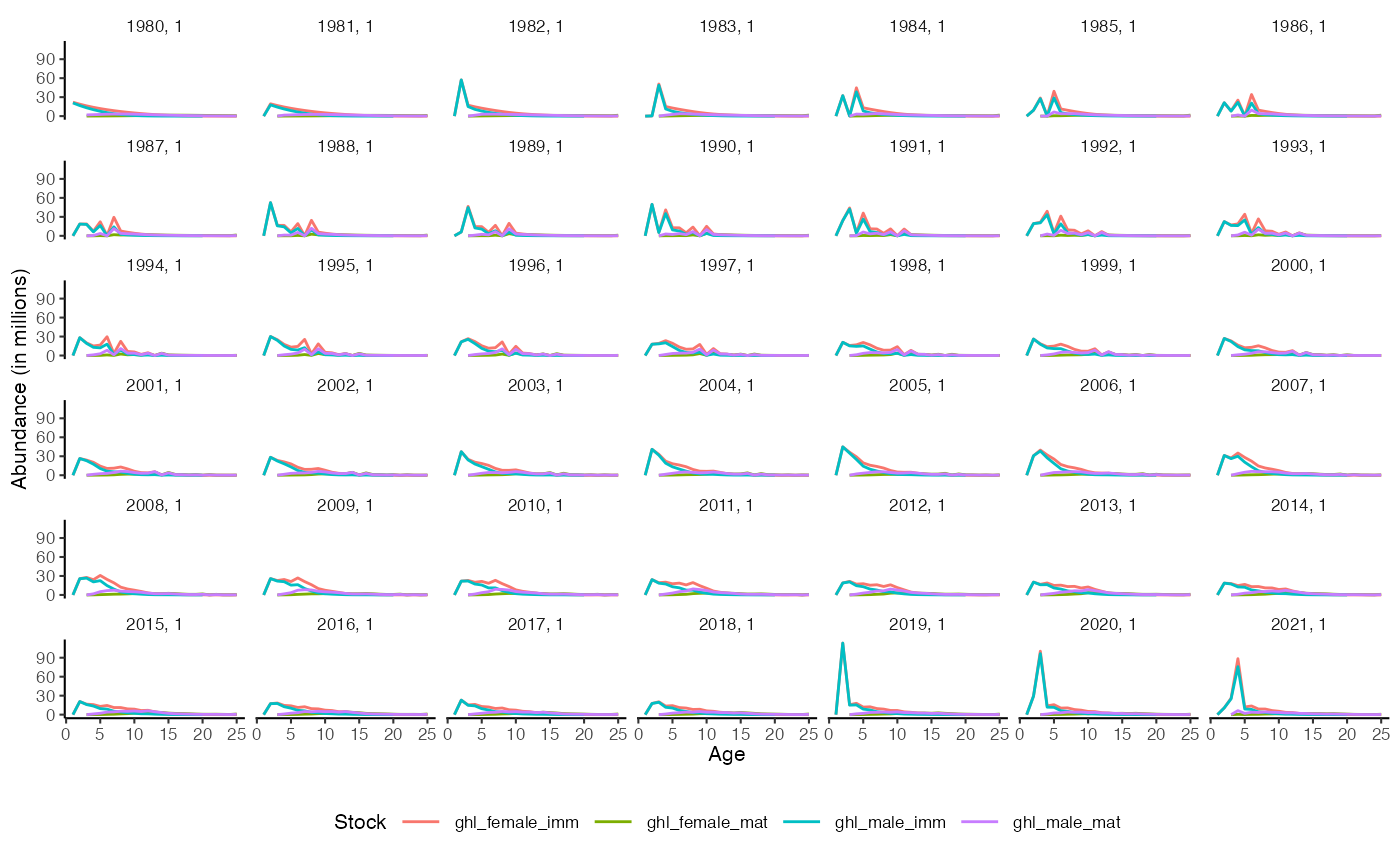
 plot_adist(fit, type = "line")
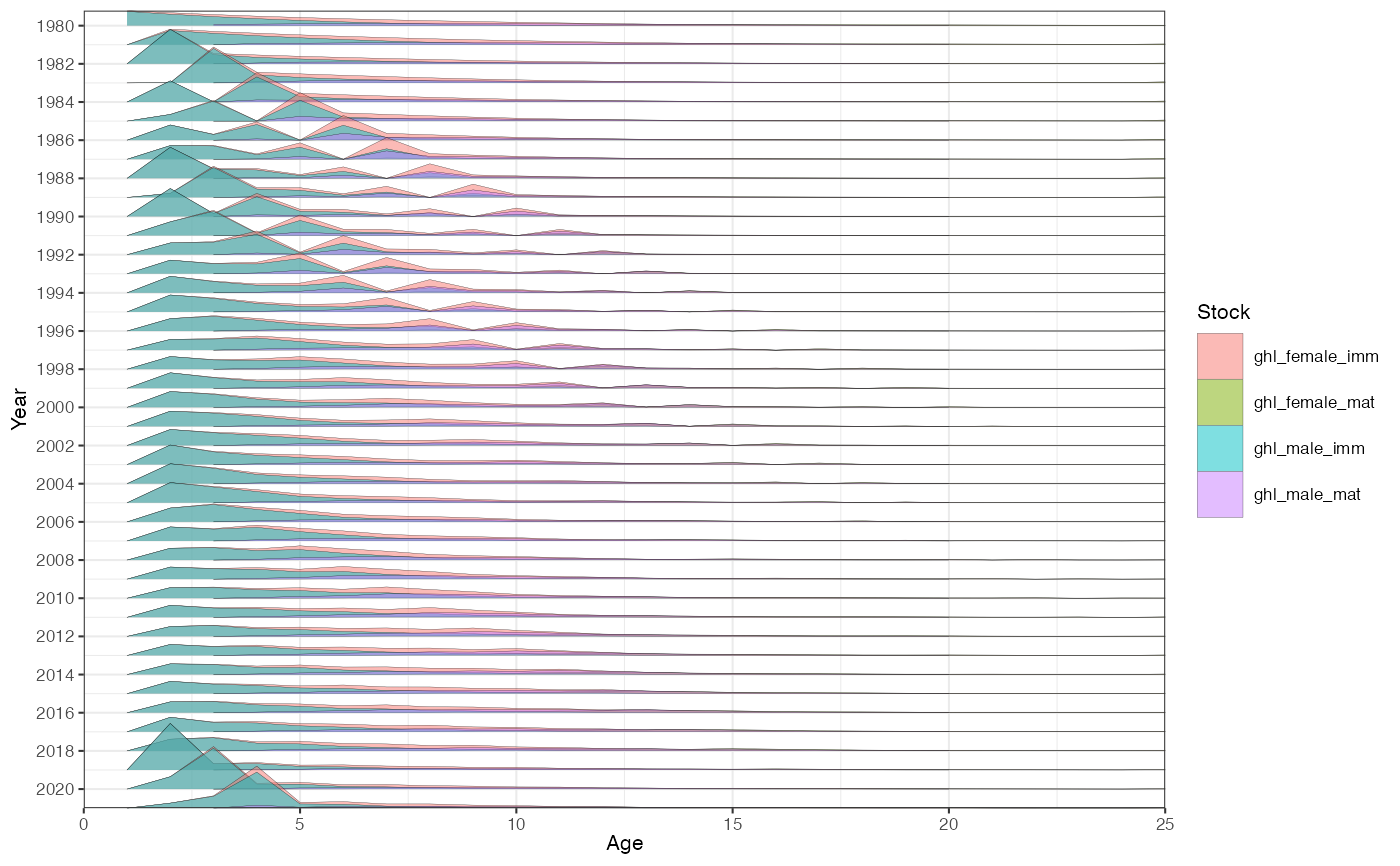
 plot_adist(fit, type = "ggridges")