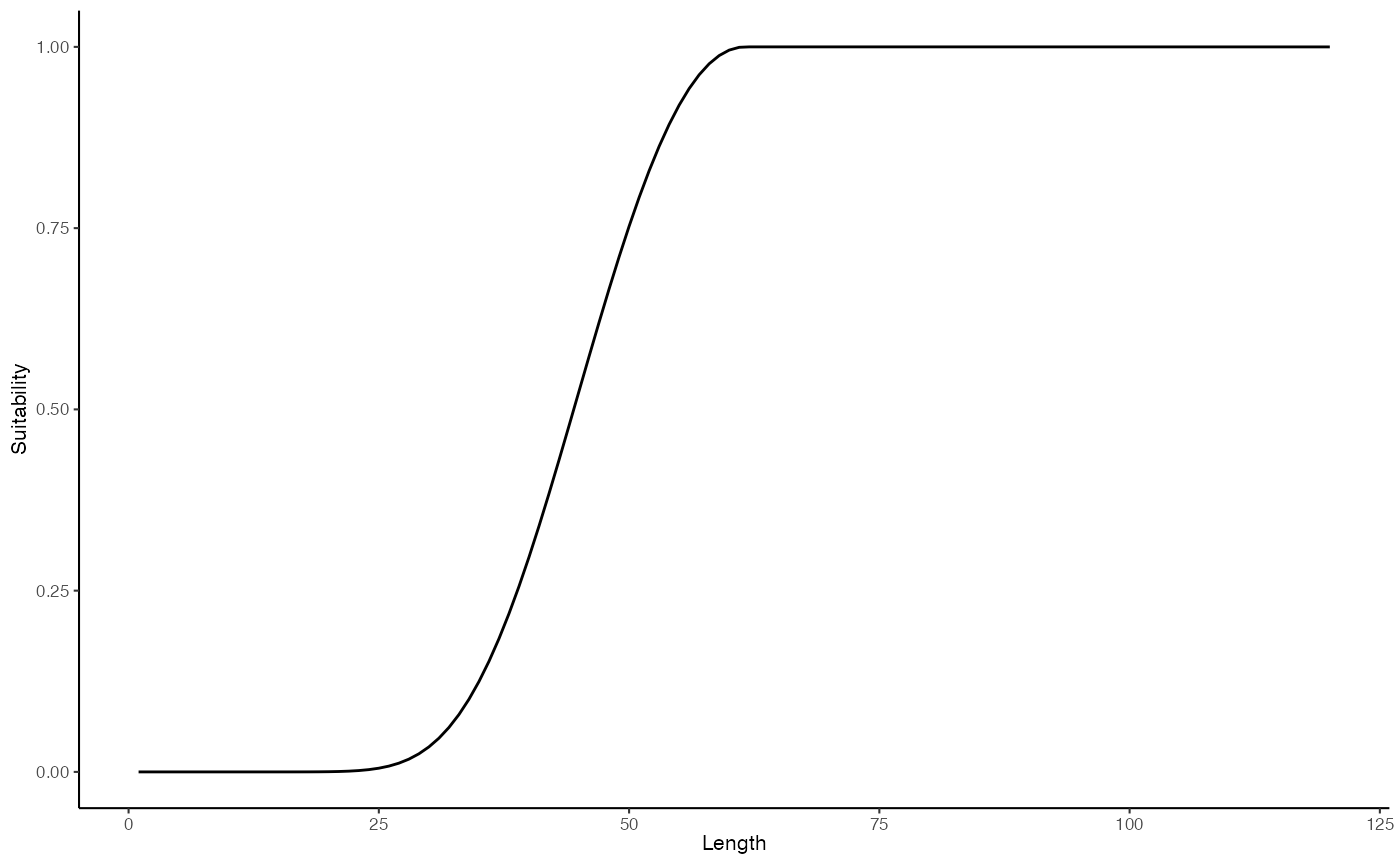
Plot Andersen suitability using model parameters
g3plot_andersen.RdPlot Andersen suitability using model parameters
Arguments
- length
Numeric vector defining the lengths for which suitabilities should be plotted
- p0, p1, p2, p3, p4, p5
(Named) numeric vectors defining the Andersen suitability function parameters. See suitability. If length > 1, multiple curves will be plotted using a different line type. All of these parameters must have the same length.
- add
Logical indicating whether the function should produce a ggplot2 layer which can be added to an existing ggplot (
TRUE) or whether to plot the results (FALSE)- base_size
Base size parameter for ggplot. See ggtheme.
- ...
Additional arguments passed to
plot_*functions.