Plot stock distribution data for a gadget3 model
dplot_stockdist.RdThe dplot functions plot data passed to a gadget3 model instead of data from the model or fit objects.
Usage
dplot_stockdist(
  x,
  stock_col = "maturity_stage",
  proportion = FALSE,
  group_by_sex = FALSE,
  sexes = c(female = "^female", male = "^male"),
  colors = NULL,
  scales = "free_y",
  dir = "v",
  base_size = 8,
  ...
)
Arguments
- x
A gadget3 ready data frame created using mfdb, g3_data or add_g3_attributes.
- stock_col
Character defining the name of the column separating stocks.
- proportion
Logical indicating whether to plot proportion of stocks instead of absolute numbers.
- group_by_sex
Logical indicating whether to take the proportions by sex (
TRUE) or by all stocks (FALSE). Used only whenproportion = TRUE- sexes
Named vector of length two containing regular expressions separating sexes in
stock_col. See the default as an example.- colors
A vector of colors to be used for stocks. If
NULL,scales::hue_pal()will be used- scales
Character specifying the
scalesargument passed tofacet_wrap. Defaults to"free_y".- dir
Character specifying the direction of the facets ("h" for horizontal, "v" for vertical). See
facet_wrap. Defaults to "v" unlike infacet_wrapto make it easier to follow length and age groups across years.- base_size
Base size parameter for ggplot. See ggtheme.
- ...
Additional arguments passed to
facet_wrap.
Value
A ggplot object.
Examples
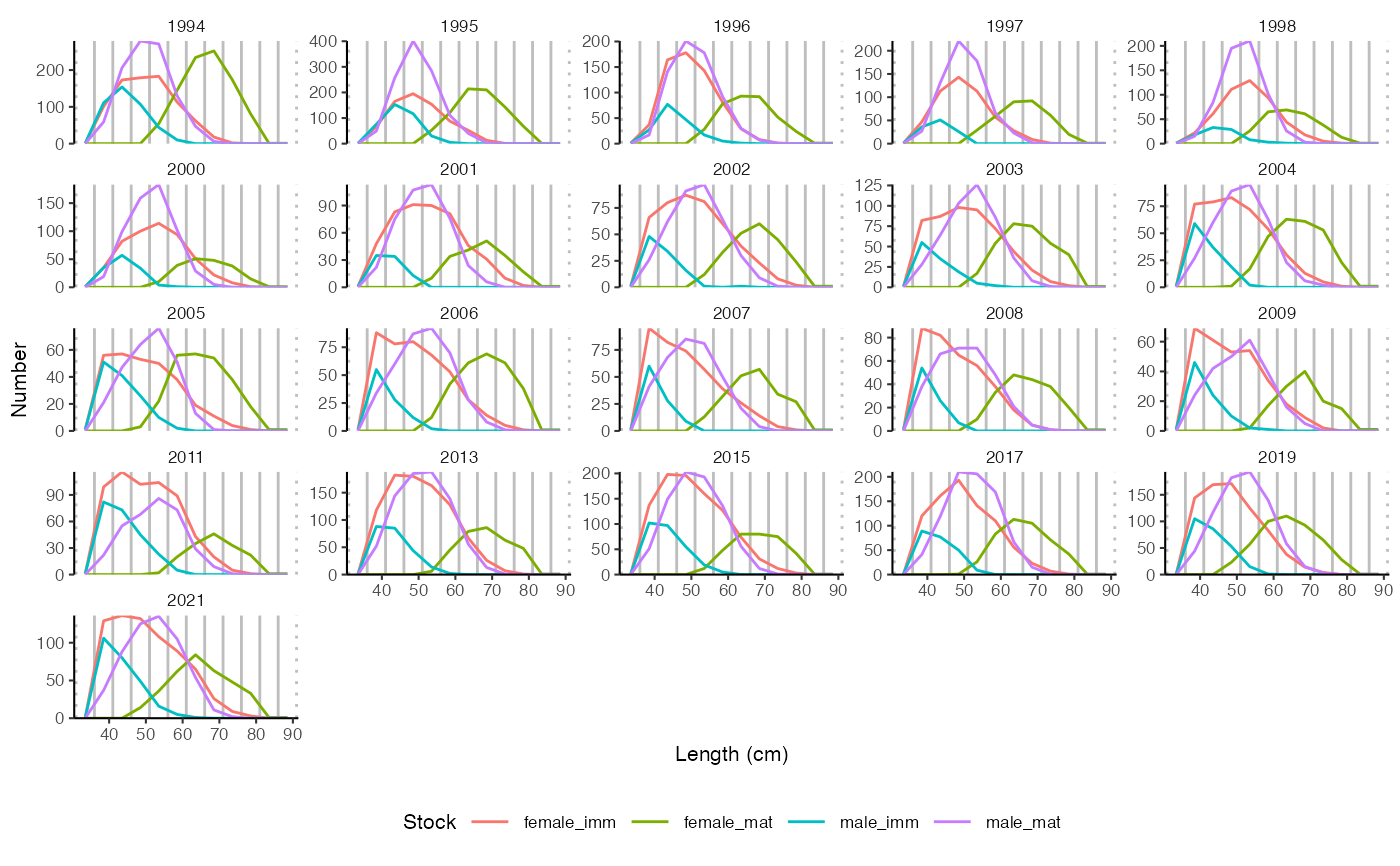
data(stockdist_example)
dplot_stockdist(stockdist_example)
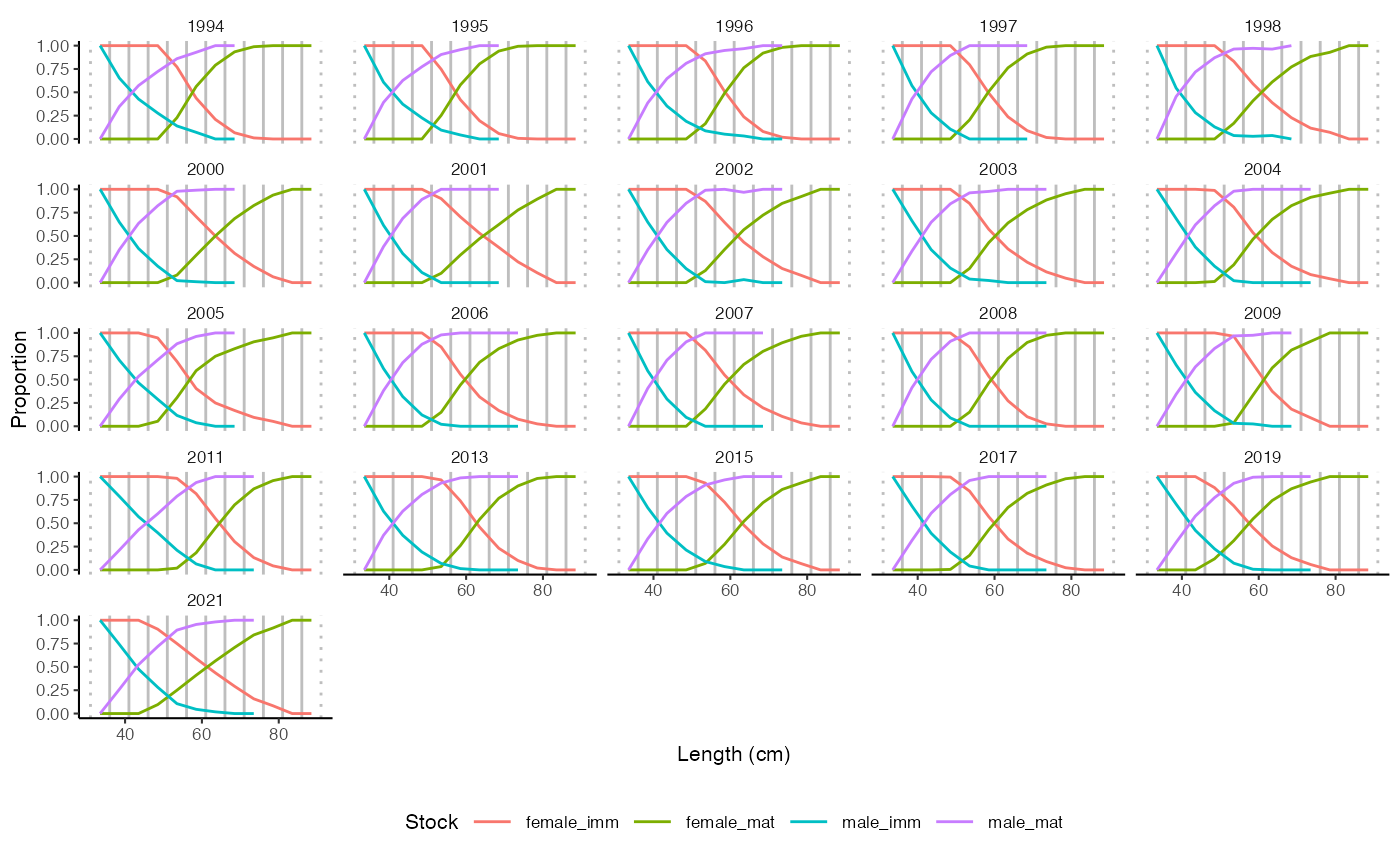
 dplot_stockdist(stockdist_example, proportion = TRUE)
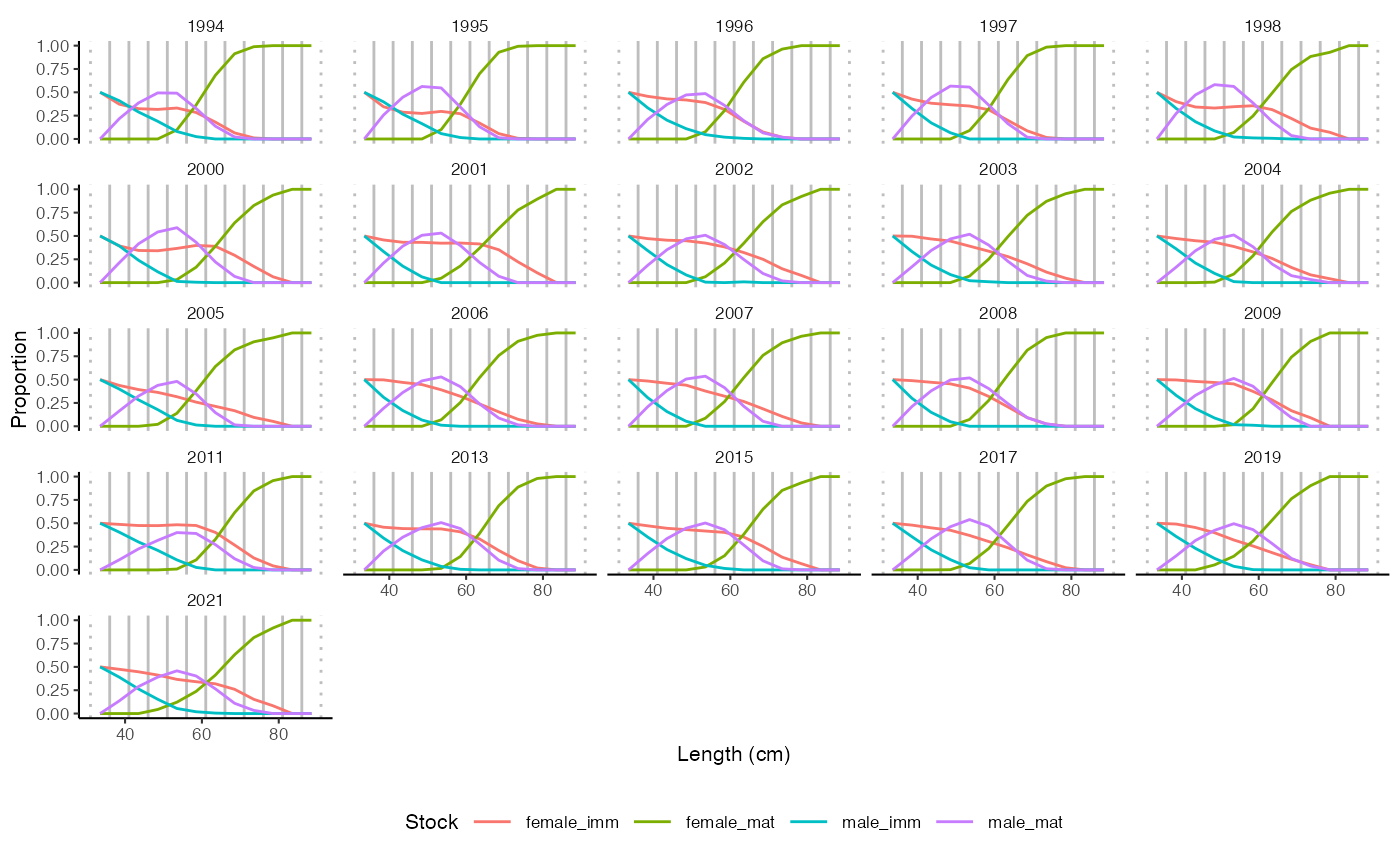 dplot_stockdist(stockdist_example, proportion = TRUE, group_by_sex = TRUE)