Plot age-length distribution data for a gadget3 model
dplot_aldist.RdThe dplot functions plot data passed to a gadget3 model instead of data from the model or fit objects.
Usage
dplot_aldist(
  x,
  type = "bar",
  facet_age = FALSE,
  dir = "v",
  color_palette = scales::brewer_pal(palette = "Set1"),
  base_size = 8,
  ...
)
Arguments
- x
A gadget3 ready data frame created using mfdb, g3_data or add_g3_attributes.
- type
Character specifying the plot type: "bar", "step", or "area". "step" produces a similar plot where age and length distributions are plotted separately as in plot_catchdist. "area" produces an area plot instead of a bar plot, but works poorly when there are many age groups.
- facet_age
Logical indicating whether ages should be plotted in separate facets. Does not apply for
type = "step".- dir
Character specifying the direction of the facets ("h" for horizontal, "v" for vertical). See
facet_wrap. Defaults to "v" unlike infacet_wrapto make it easier to follow length and age groups across years.- color_palette
A function defining the color palette to be used for fill of bars when
facet_age = TRUE. See scale_color_manual. To adjust color whenfacet_age = FALSE, use the standardggplot2::scale_fill_*functions.- base_size
Base size parameter for ggplot. See ggtheme.
- ...
Additional arguments passed to
facet_wrap.
Value
A ggplot object.
Examples
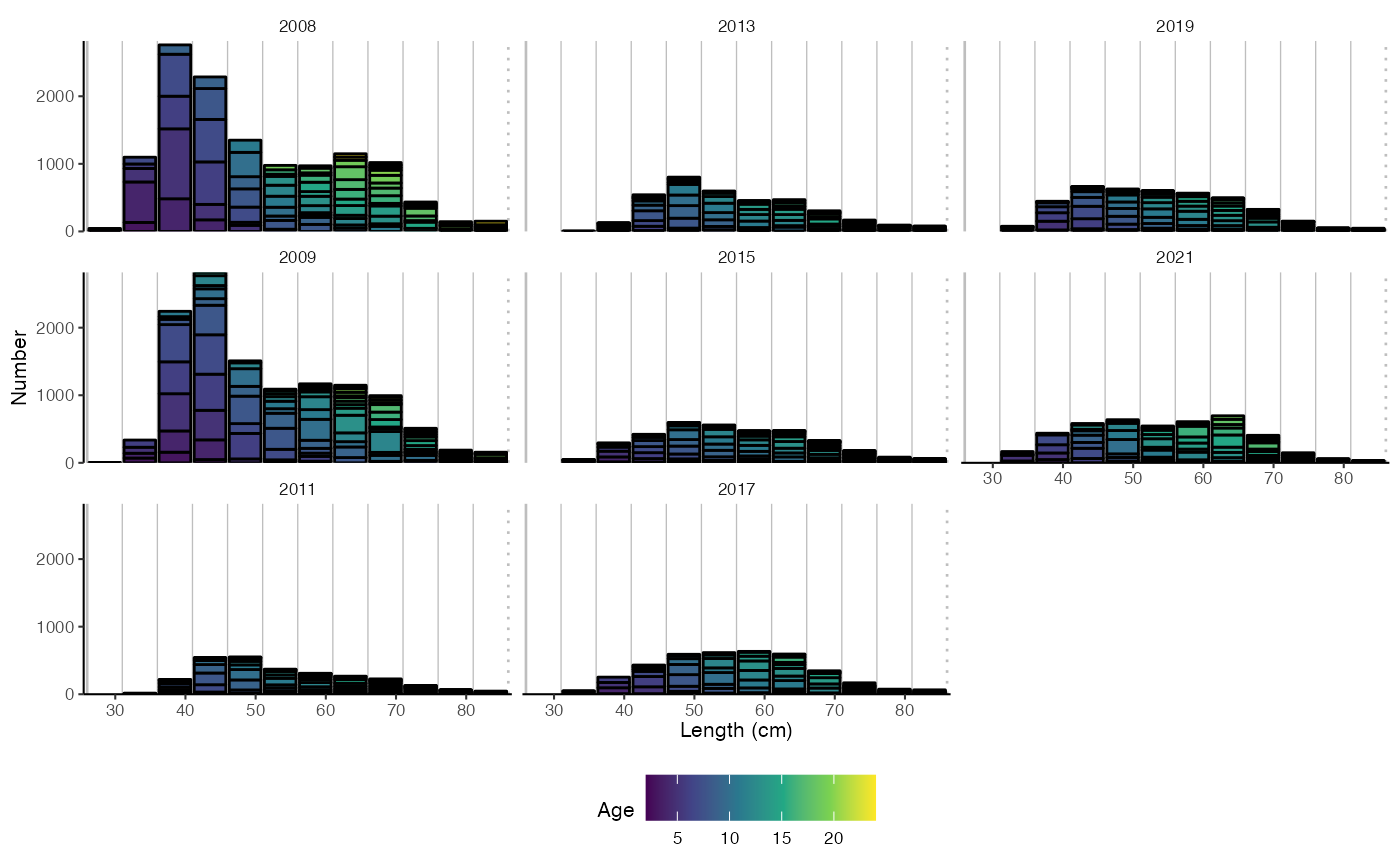
data(aldist_example)
dplot_aldist(aldist_example)
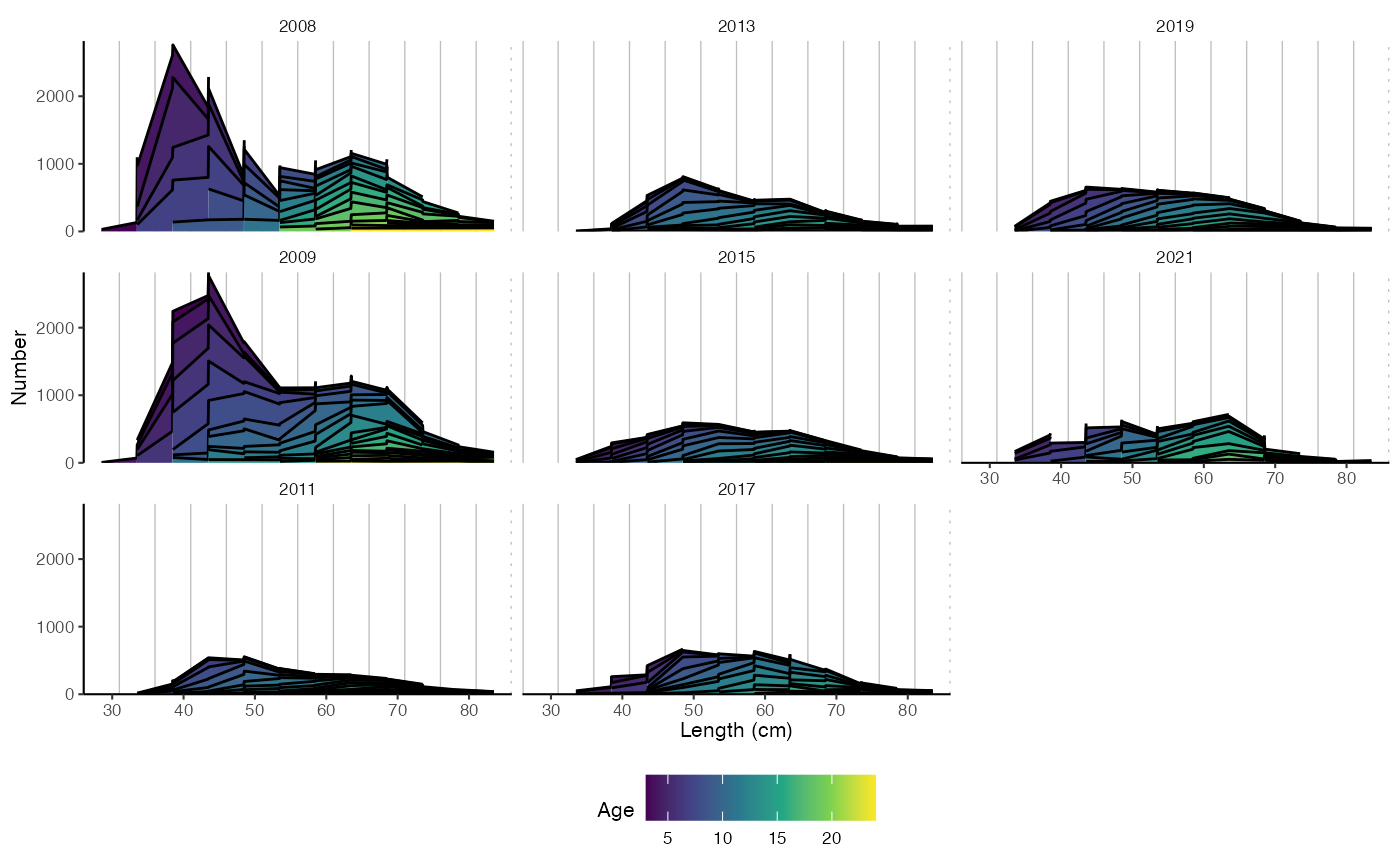
 dplot_aldist(aldist_example, type = "step") # as in plot_catchdist
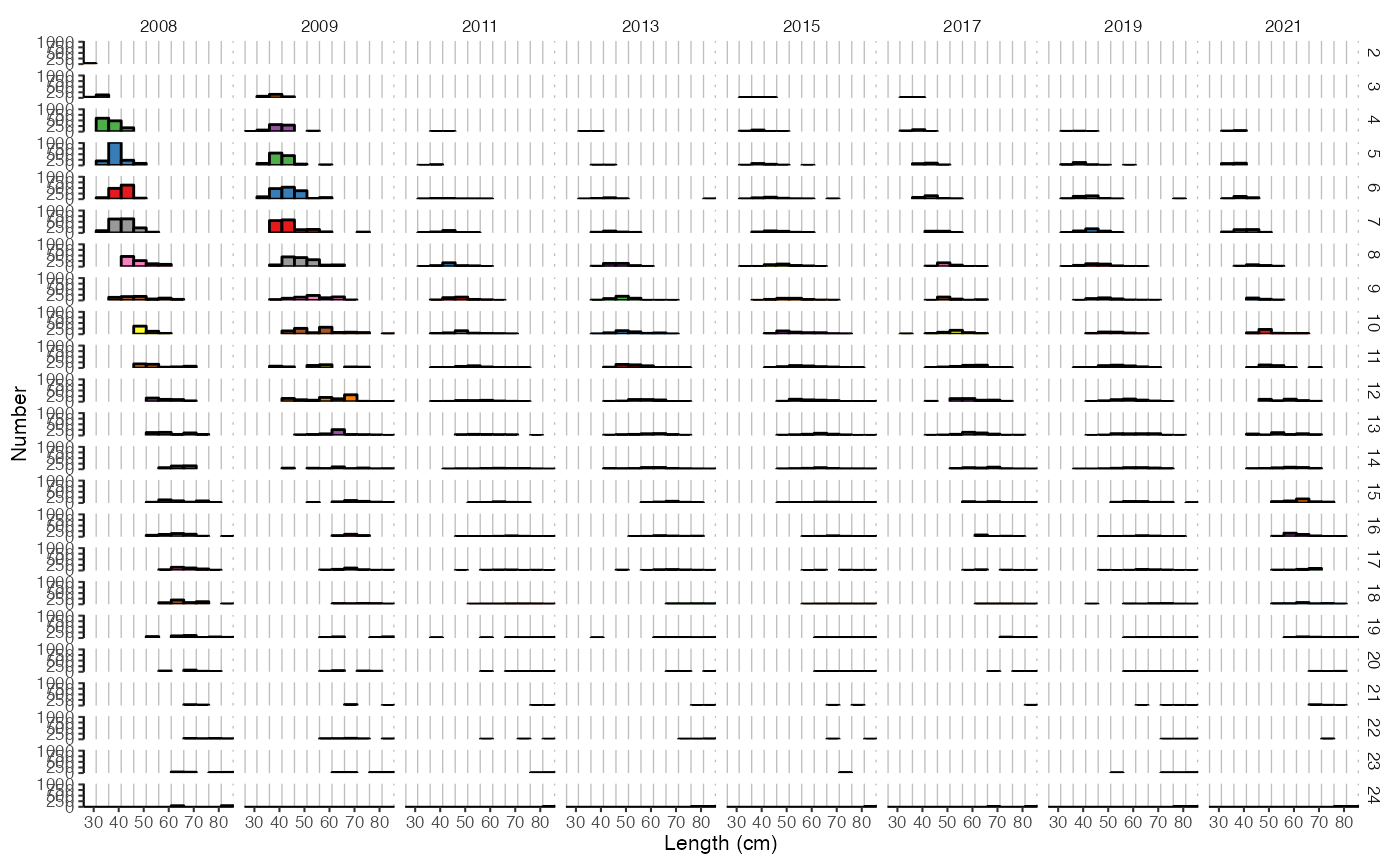 dplot_aldist(aldist_example, facet_age = TRUE)
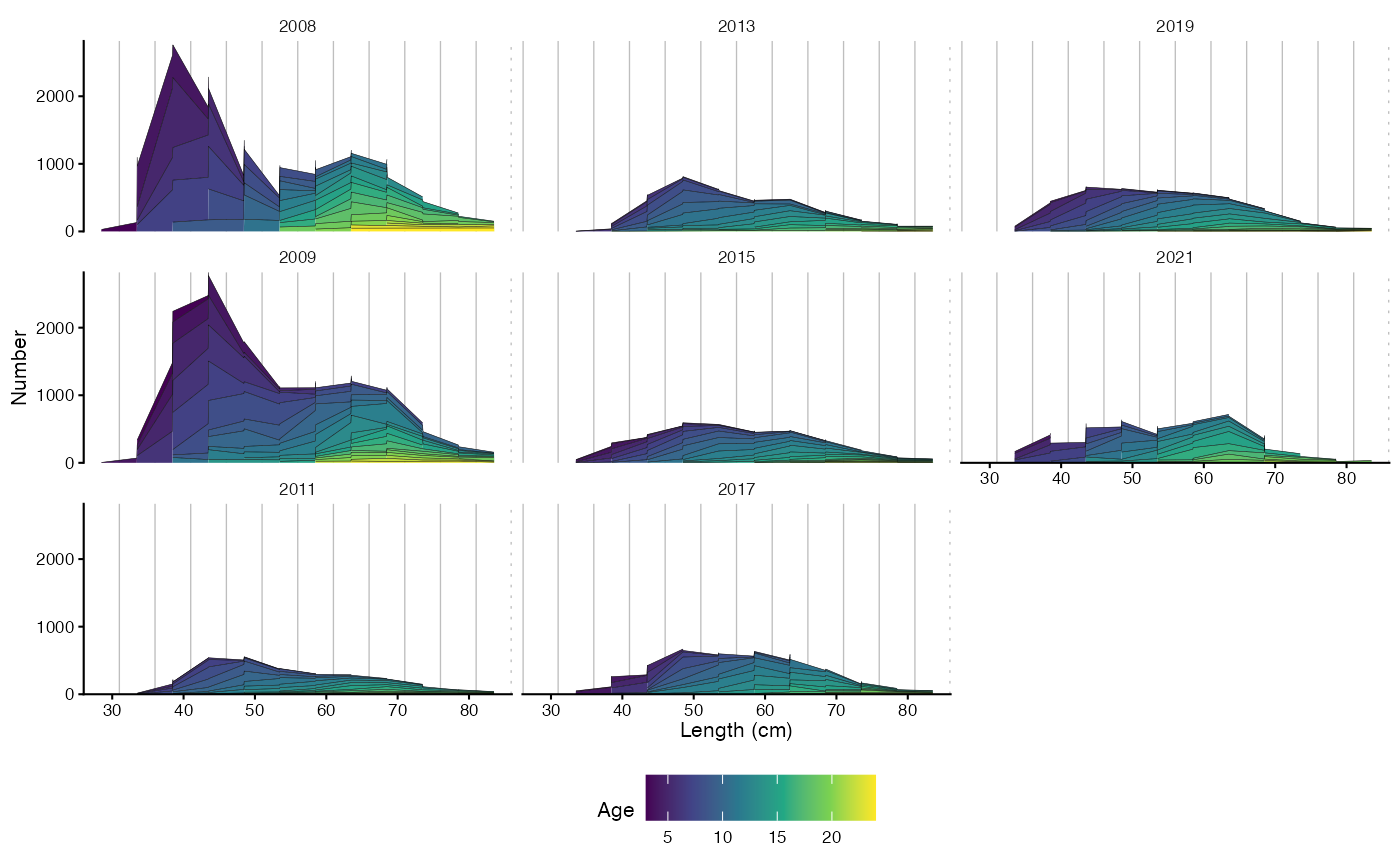
 dplot_aldist(aldist_example, type = "area") # works poorly