Plot age distribution data for a gadget3 model
dplot_adist.RdThe dplot functions plot data passed to a gadget3 model instead of data from the model or fit objects.
Usage
dplot_adist(
  x,
  type = "bar",
  color_palette = scales::brewer_pal(palette = "Set1"),
  dir = "v",
  base_size = 8,
  ...
)
Arguments
- x
A gadget3 ready data frame created using mfdb, g3_data or add_g3_attributes.
- type
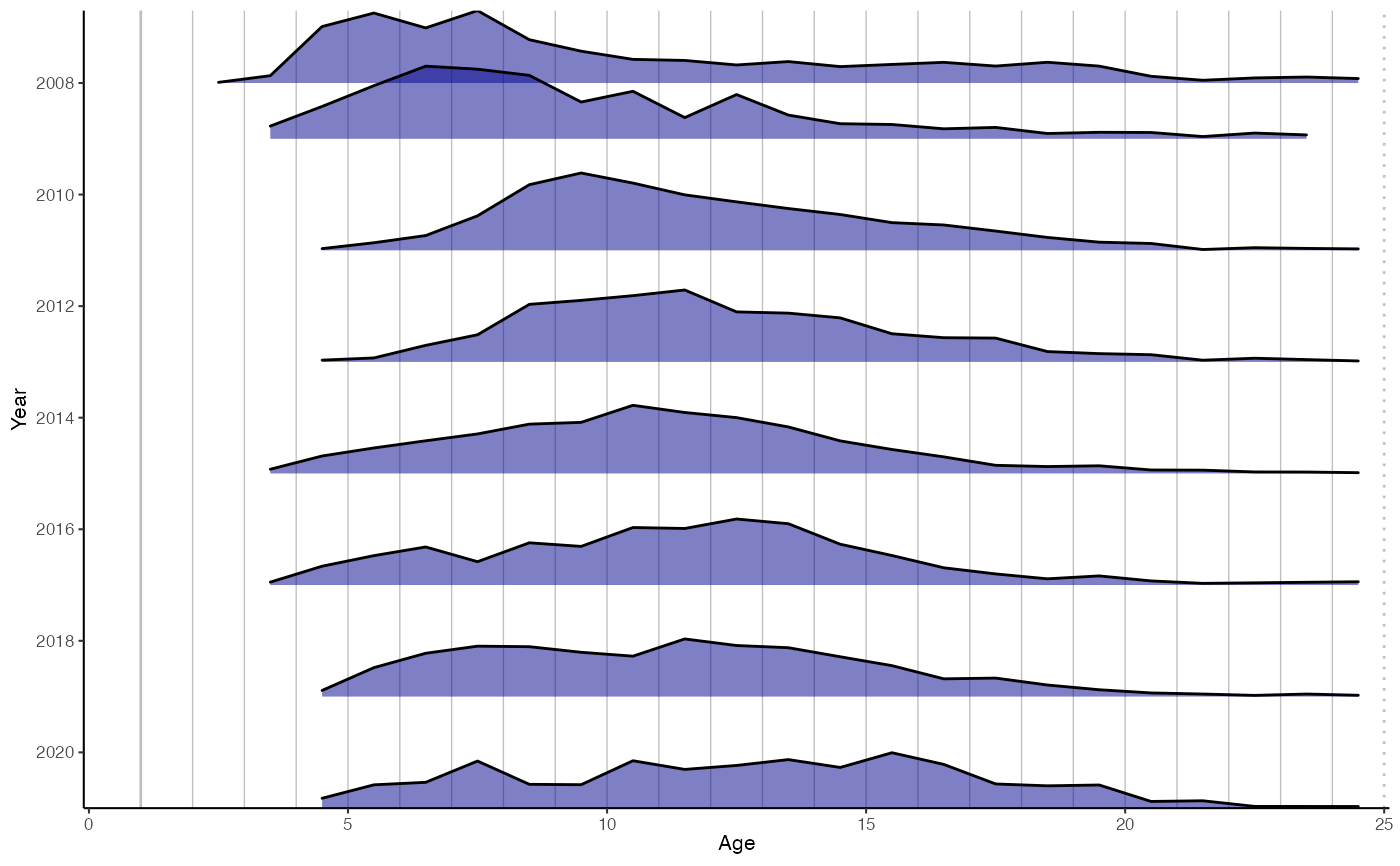
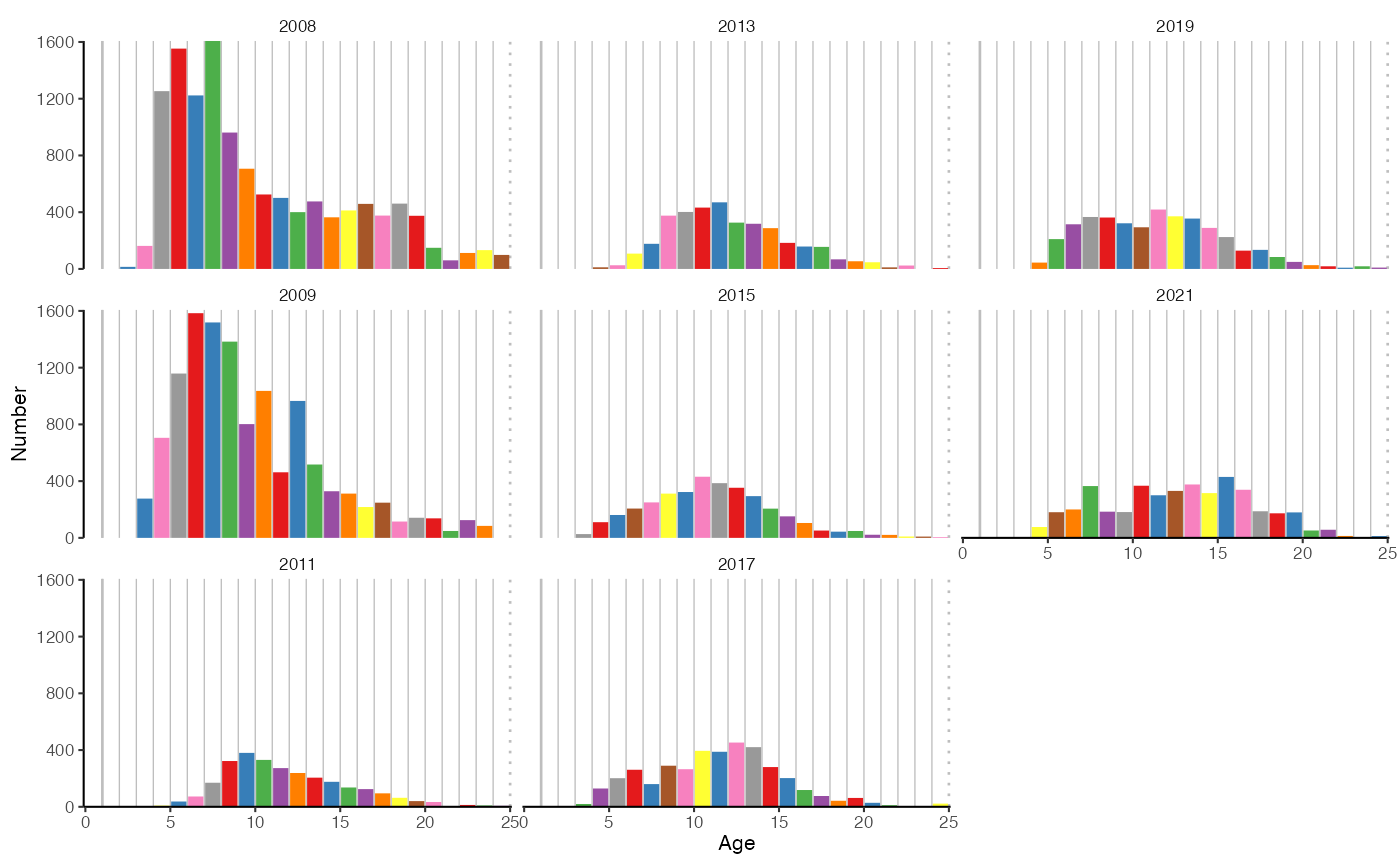
Character specifying the plot type: "bar" or "ggridges".
- color_palette
A function defining the color palette to be used for fill of bars.
- dir
Character specifying the direction of the facets ("h" for horizontal, "v" for vertical). See
facet_wrap. Defaults to "v" unlike infacet_wrapto make it easier to follow length and age groups across years.- base_size
Base size parameter for ggplot. See ggtheme.
- ...
Additional arguments passed to
facet_wrap.
Value
A ggplot object.
Examples
data(aldist_example)
dplot_adist(aldist_example)

dplot_adist(aldist_example, type = "ggridges")